
Agent Monitor · Launch Video Breakdown: Hook, Pacing & Motion Design
Agent Monitor is a free, open-source IDE extension that shows what your coding agents covered, what they skipped, and what they’re looking at.
Scene-by-scene timeline & spoken transcript
The Hook
Introducing Agent Monitor: See What Your Coding Agents Are Doing
“Introducing Agent Monitor, a free extension for your IDE that shows what your coding agents are actually working on. When you're running several agent chats at once, it's easy to lose track of what each one has actually covered, what they skipped, and what they're looking at.”
- On screen
- Agent Monitor An extension for your IDE that shows what your coding agents are working on.
- Camera
- Static shot of product logo and tagline, then a slow zoom into the IDE interface.
- Motion
- Subtle logo reveal with text fade-in, followed by a smooth, controlled zoom into the product UI.
Product Reveal
Focus Areas: Comprehensive Agent Activity Scoring
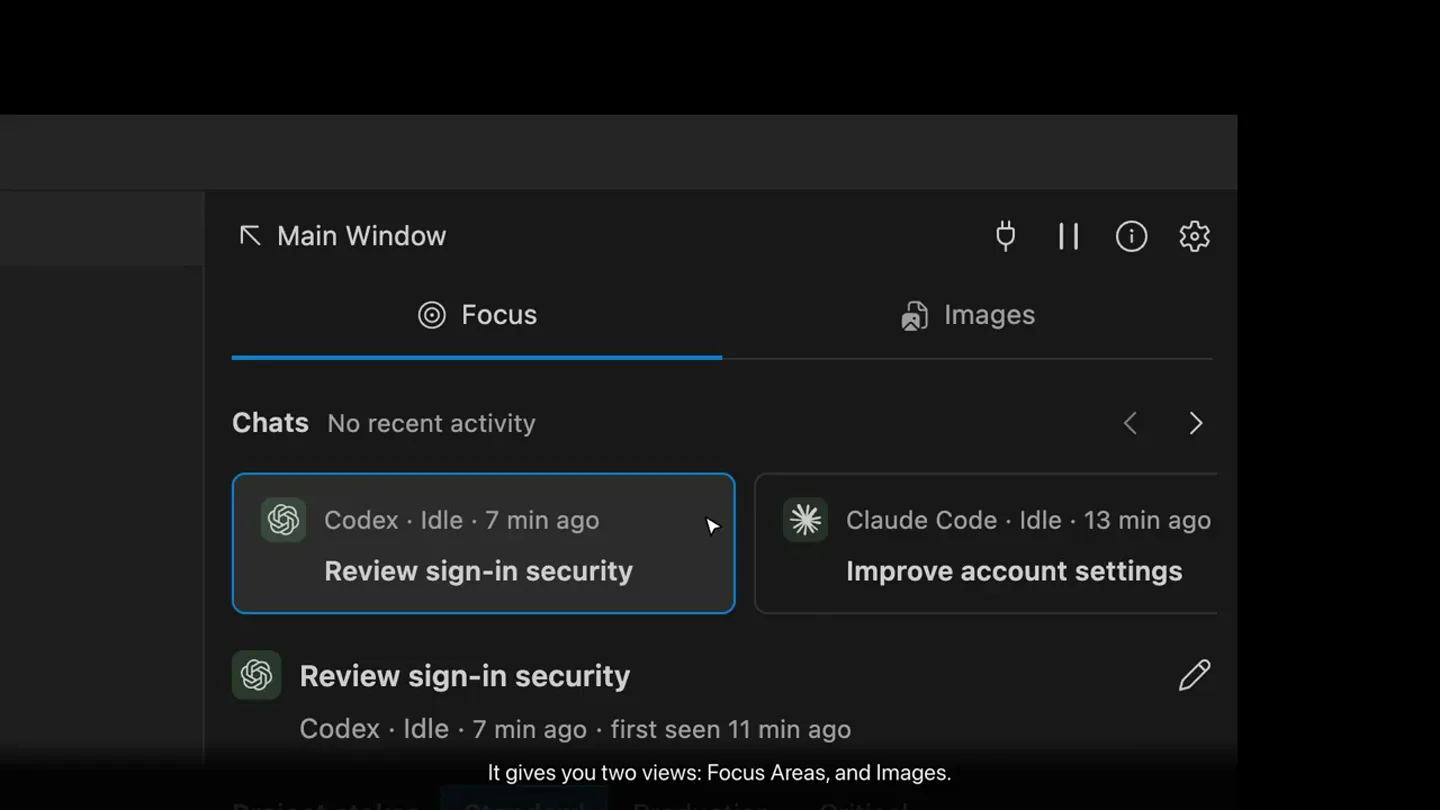
“Agent Monitor gives you two views: Focus Areas and Images. First, Focus Areas. Every chat is scored across 13 engineering areas, like Security, Testing, and Documentation. So you can tell, at a glance, what's been reviewed, and what's been skipped. That frees you to focus on shipping features, with the right scope covered in every chat. Agent Monitor reads tool calls and shell commands like a developer, so it's fast, accurate, and cheap to run.”
- On screen
- Main Window Focus Images Chats No recent activity Codex · Idle · 7 min ago Review sign-in security Claude Code · Idle · 13 min ago Improve account settings Review sign-in security Codex · Idle · 7 min ago · first seen 11 min ago Project stakes Standard Production Critical Prototypes, internal tools and personal projects. Applies to new activity. Focused areas Choose areas Security 38 2 subjects - just now Focus here Performance No activity Focus here UI / UX No activity Focus here Functionality 31 2 subjects - just now Focus here Data No activity Focus here Testing No activity Focus here More areas // how Agent Monitor reads one tool call Claude Code Edit src/auth/useAuthToken.ts ↓ split into words src auth use auth token .ts ↓ matched against the taxonomy security "auth" in path 0.90 functionality .ts file 0.60 // context can override the obvious match src/components/DataTable.tsx data → // it reads shell like a developer $ cd web && npm test 2 // fast, accurate, and cheap to run
- Camera
- Pans and zooms within the IDE interface, highlighting specific UI elements and code snippets.
- Motion
- Dynamic UI element highlighting with animated progress bars and text reveals, simulating user interaction and data processing.
Feature Teaser
Interactive Focus & Customization
“This chat has done plenty of security work, but no testing. One click on Focus here tells it what to cover next. Its following tool calls show up right here, so you can confirm it actually followed through. So you're never just trusting a number. Agent Monitor also flags sensitive changes, like migrations, secrets, or authentication — so reviewers never have to remember to look. Built-in areas cover general engineering. But your product has its own risks, like checkout or billing. Your agent can draft a custom area from your real repo, and it only counts once you approve it.”
- On screen
- Focused areas Choose areas Security 50 3 subjects - just now Focus here Performance No activity Focus here UI / UX No activity Focus here Functionality 43 3 subjects - just now Focus here Data No activity Focus here Testing No activity Focus here Sent! Task is focusing here... More areas Security Access control and protection against misuse. Inspected, changed - 3 subjects tests/auth/csrf.test.ts Changed "auth" in path - 1 min ago server/middleware/rateLimit.ts Changed "ratelimit" in path - 5 min ago server/permissions.ts How the score works UI / UX No activity Focus here Functionality 42 3 subjects - 4 min ago Focus here Review sign-in security Codex · Active - just now · first seen 22 min ago Project stakes Standard Production Critical Real users, money or data depend on it. Marks sensitive changes such as migrations, access control, secrets and deployment. Applies to new activity. Focused areas Choose areas Security 59 4 subjects - just now Focus here Performance No activity Focus here UI / UX No activity Focus here Functionality 41 3 subjects - 5 min ago Focus here Data 7 1 sensitive change - 1 subject - just now Focus here Testing 29 2 subjects - 1 min ago Focus here Sent! Task is focusing here... More areas Reliability No activity Focus here Code quality No activity Focus here Create your own Focus Area Your AI agent looks through this project and sets it up. You approve it before it counts. Name Checkout flow Details Optional Cart p Folders, services or rules that help your agent find it. Kind of product Optional General software Helps your agent use the right words for your field. Who sets it up Claude Code Runs in a terminal here. Codex Runs in a terminal here. Copy Instructions Paste into any AI assistant. Create Focus Area Cancel
- Camera
- Continues to pan and zoom, focusing on interactive elements like 'Focus here' buttons, expanding sections, and form inputs.
- Motion
- Interactive UI animations, including button clicks, progress bar updates, and form field population, demonstrating real-time feedback and customization.
Call to Action
Image Monitoring & Availability
“Second, Images. Every screenshot and image a chat looks at is kept here, in order. What it viewed matters just as much as what it changed. Agent Monitor is a free, open-source extension for VS Code and Cursor. Get it today.”
- On screen
- Focus Images Chats All chats 1 chat Codex · just now Review sign-in security Images 1 of 1 just now Follow latest Sign in Welcome back to Acme Email dona@acme.dev Password Session expired. Please sign in again. Sign in Use SSO Forgot password? Viewed image Recently viewed by Codex Codex · just now · 1280 × 800 Agent Monitor Free, open-source extension for VS Code and Cursor VS Code Marketplace marketplace.visualstudio.com/items?itemName=wojake.agent-monitor-focus Open VSX (Cursor) open-vsx.org/extension/wojake/agent-monitor-focus GitHub github.com/mov-bx-0xb800/agent-monitor
- Camera
- Pans to the 'Images' tab, scrolls through image previews, then transitions to a static screen displaying download links.
- Motion
- Smooth tab switching, scrolling animation for image gallery, and a clean fade-in for the final call-to-action screen with multiple links.
Motion design primitives
Synthesizable in Remotion · key components of the developer-tool-showcase-dark template.
IDEFocusZoom
A smooth, controlled zoom into specific sections of an IDE interface, highlighting relevant code, chat logs, or UI panels. This often involves a slight camera pan to center the focus area.
+ Code construction recipe
Use `interpolate` for camera position (x, y) and scale, with a `spring` function for easing. Implement `AbsoluteFill` for the base IDE screen and `Sequence` for timed zooms. Utilize `OffthreadVideo` for the base IDE footage and `AbsoluteFill` with `z-index` for overlaying UI elements and text.
DynamicUIPanelHighlight
Interactive UI elements like progress bars, text fields, and buttons animate to simulate user interaction and data updates. This includes filling progress bars, typing text, and button click feedback.
+ Code construction recipe
Employ `interpolate` for `width` or `opacity` properties of progress bars and text elements. Use `spring` for button press animations (scale, opacity). Text typing can be achieved with `Sequence` and `Character` components, revealing text character by character.
CodeSnippetReveal
Code or terminal commands appear line by line or word by word within a dark, rounded rectangular container, often accompanied by explanatory comments.
+ Code construction recipe
Use `Sequence` to reveal lines of code or words with a `spring` or `linear` interpolation for `opacity` and `y` position. The container can be a simple `AbsoluteFill` with `borderRadius` and a dark background color. Text can be rendered using a `Code` component or simple `Text` components with a monospace font.
Style DNA & aesthetic system
Visual aesthetic
Typography
Motion
Special effects
Pacing & rhythm
Conceptual story rhythm
- 1
Problem Introduction & Solution Tease
Purpose. Immediately establish the core problem developers face with coding agents and introduce Agent Monitor as the solution.
Execution. Logo reveal followed by a slow zoom into a busy IDE, visually representing the complexity Agent Monitor aims to simplify.
- 2
Core Feature Deep Dive: Focus Areas
Purpose. Explain Agent Monitor's primary functionality for tracking agent coverage and identifying gaps.
Execution. Dynamic UI animations showcasing the 'Focus Areas' panel, with progress bars filling and categories updating, interspersed with code snippet breakdowns of how the tool works.
- 3
Advanced Features & Customization
Purpose. Demonstrate the tool's interactive capabilities, sensitive change flagging, and custom area creation.
Execution. Simulated user interaction with 'Focus here' buttons, expanding detail views, and form filling for custom focus area creation, emphasizing control and flexibility.
- 4
Comprehensive Monitoring & Call to Action
Purpose. Highlight the 'Images' feature for visual context and provide clear instructions on how to access the tool.
Execution. Transition to the 'Images' tab with scrolling previews, concluding with a static screen displaying download links and the product tagline.
Remix in Animatiq Studio
Master remix prompt · agent-ready
Sample remix
Objective
A new CLI tool called 'DataFlow Debugger' that visualizes data pipelines and identifies bottlenecks.How the recipe adapts
The IDEFocusZoom primitive would adapt to zoom into different sections of the DataFlow Debugger's terminal output, highlighting specific data nodes or error logs. DynamicUIPanelHighlight would be used for interactive elements within a web-based dashboard that accompanies the CLI, showing real-time data flow and bottleneck indicators. CodeSnippetReveal would demonstrate example CLI commands for debugging and configuration, with animated output showing data transformations. The dark theme and smooth transitions would be maintained, focusing on clarity for complex data visualizations.Remix blueprint · developer-tool-showcase-dark
Scene durations (4 scenes, 87s)
Key Remotion components
Related Developer Tools Product Launches
Explore all Developer Tools launches →
Agentic CLI for coding, building apps, and automating workflows.

AI is already smart enough. Real-world tasks are still slow, expensive and unreliable, because we hand AI a computer built for humans, then wrap it in a heavy harness. AI doesn’t need to get smarter

Big day 🔥 🚀 Introducing Dolphin AI - an agentic AI studio for complete video production. The story of Dolphin is very interesting. It didn’t start as a product. It started as an internal tool. W