
Cursor · Launch Video Breakdown: Hook, Pacing & Motion Design
Cursor can build charts and diagrams in chat. /visualize analyzes data and shows the answer inline in the Agents Window.
Scene-by-scene timeline & spoken transcript
The Hook
The Power of Visualization
“(No spoken dialogue — Ethereal pad sound builds, subtle high-frequency riser begins.)”
- On screen
- Some things are better left unsaid|
- Camera
- Static, centered text on a light background.
- Motion
- Typing cursor animation, text reveal.
Problem Agitation
Unveiling Complex Data
“(No spoken dialogue — Soft sub-bass impact, rhythmic arpeggiated synth, gentle pulsing bassline. High-frequency sweep and riser builds.)”
- On screen
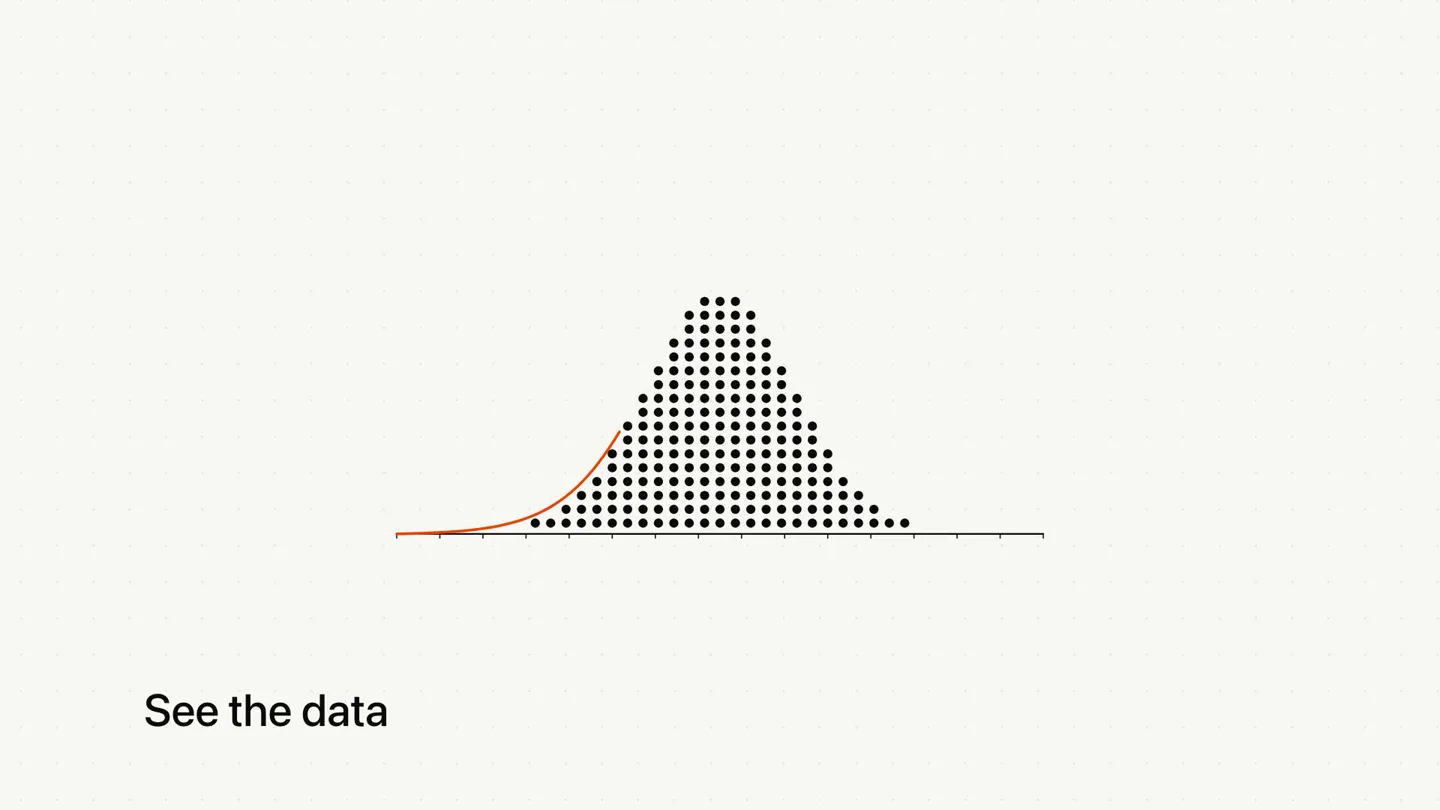
- /visualize instead| See the data Explore systems Find cause and effect
- Camera
- Static, centered abstract data visualizations.
- Motion
- Procedural data visualization animations (Gaussian distribution, node graphs, Venn diagrams, spherical coordinates), text fades in from bottom left.
Product Reveal
From Micro to Macro Insights
“(No spoken dialogue — Pronounced sub-bass drop and impact. Arpeggiated synth becomes more prominent. High-energy riser and sweep intensifies rapidly.)”
- On screen
- From molecules... to mathematics... and more
- Camera
- Static, centered abstract scientific and mathematical visualizations.
- Motion
- Complex procedural animations (molecular structures, torus, spiral patterns), text fades in from bottom left.
Call to Action
Cursor: Visualize Everything
“(No spoken dialogue — Powerful sub-bass drop and impact, driving percussive synth rhythm, deeper sustained bass. Very intense high-energy riser, massive sub-bass drop, bright sustained synth chord, powerful resonant bass, then fades out.)”
- On screen
- /visualize|
- Camera
- Static, centered text and logo reveal.
- Motion
- Typing cursor animation, logo build-up from abstract shapes, subtle background texture.
Motion design primitives
Synthesizable in Remotion · key components of the abstract-data-visualizer-launch template.
TypingCursorReveal
Text appears character by character with a blinking vertical line cursor, simulating real-time typing. The cursor has a distinct color.
+ Code construction recipe
Use Remotion's `Sequence` and `spring` or `interpolate` for character opacity and position. A `Line` component with `spring` for opacity and `x` position can simulate the blinking cursor. Use `loop` for the blink.
ProceduralDataMorph
Abstract data points and lines dynamically connect, morph, and colorize to form different scientific or mathematical diagrams (e.g., Gaussian curve, node graph, molecular structure).
+ Code construction recipe
Leverage Remotion's `Canvas` or `SVG` components. Animate `d` attributes for SVG paths, `cx`/`cy`/`r` for circles, and `x1`/`y1`/`x2`/`y2` for lines. Use `interpolate` for smooth transitions between different data states and `spring` for organic growth/connection animations. Color changes can be animated with `interpolateColor`.
AbstractGeometricBuild
Simple geometric shapes (e.g., a chevron, a triangle) combine and rotate to form a more complex, stylized logo or icon.
+ Code construction recipe
Utilize Remotion's `Path` or `Shape` components. Animate `transform` properties (rotate, scale, translate) and `opacity` using `spring` or `interpolate` to create a fluid assembly sequence. Ensure precise timing with `Sequence` to align shape appearances.
Style DNA & aesthetic system
Visual aesthetic
Typography
Motion
Special effects
Pacing & rhythm
Conceptual story rhythm
- 1
The Enigmatic Question
Purpose. Hook the viewer with a relatable problem statement about unspoken complexities.
Execution. A single line of text appears with a typing cursor, creating intrigue.
- 2
The Visualization Promise
Purpose. Introduce the core solution: the power of visualization to clarify complex data and systems.
Execution. Abstract data visualizations morph and evolve, accompanied by short, impactful text phrases.
- 3
The Scope of Application
Purpose. Demonstrate the breadth of the product's capabilities, from microscopic to macroscopic data.
Execution. A rapid sequence of diverse scientific and mathematical visualizations, building in complexity and energy.
- 4
The Brand Reveal
Purpose. Conclude with the product name and logo, solidifying the brand's identity.
Execution. The product name appears with a typing cursor, followed by a geometric logo animation, synchronized with the audio climax.
Remix in Animatiq Studio
Master remix prompt · agent-ready
Sample remix
Objective
A new AI-powered code refactoring tool called 'Syntactiq' that visualizes code dependencies.How the recipe adapts
The TypingCursorReveal primitive would introduce 'Syntactiq: Refactor Smarter'. The ProceduralDataMorph primitive would animate abstract code dependency graphs, showing nodes (functions/modules) and lines (dependencies) dynamically reorganizing and highlighting refactored paths. The AbstractGeometricBuild primitive would form the Syntactiq logo from stylized code bracket shapes. The color palette would shift to cool blues and greens, maintaining the clean aesthetic.Remix blueprint · abstract-data-visualizer-launch
Scene durations (4 scenes, 32.9s)
Key Remotion components
Related Developer Tools Product Launches
Explore all Developer Tools launches →
Agentic CLI for coding, building apps, and automating workflows.
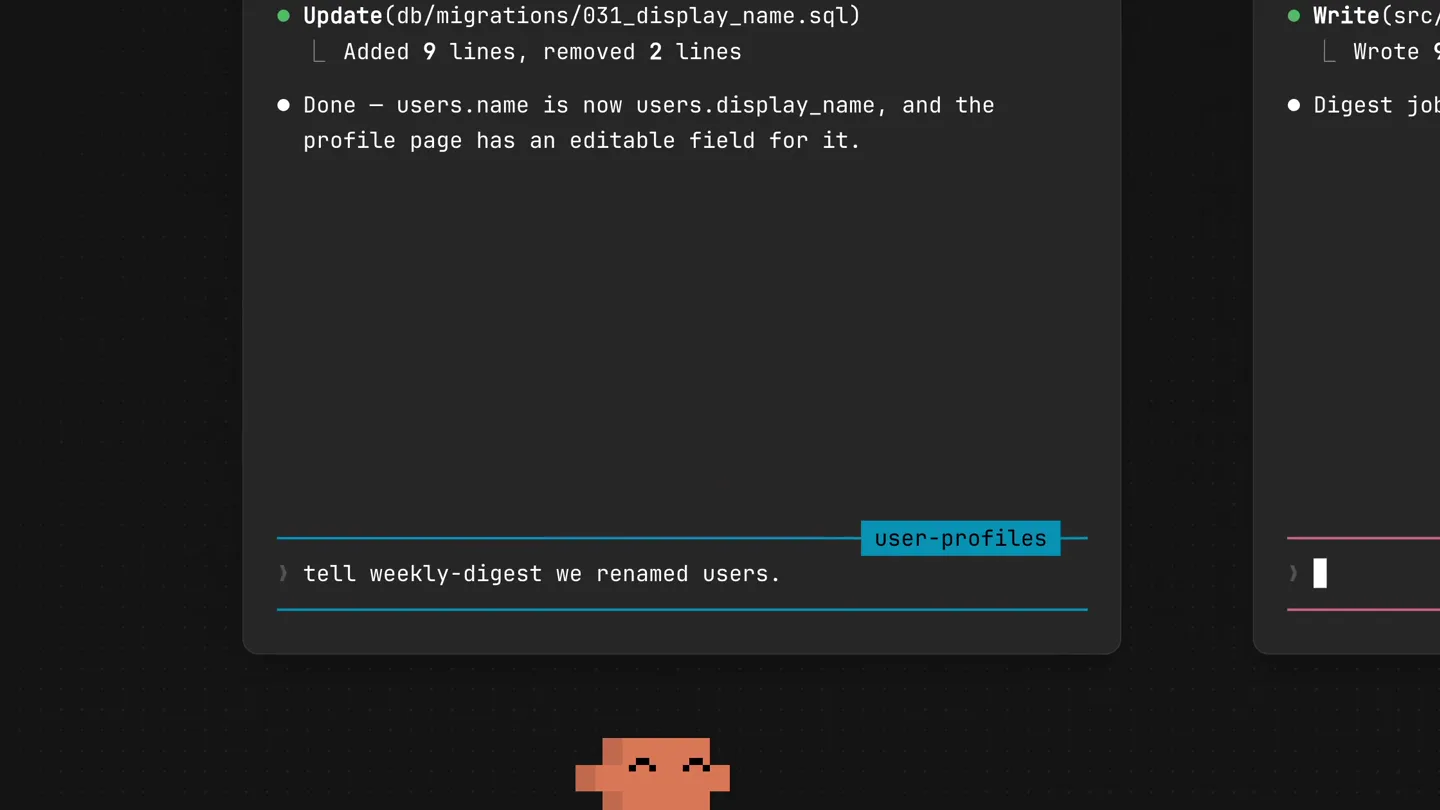
New in Claude Code: your sessions can now message each other. Tell Claude to send a summary (not your history or files), and the other session picks it up mid-task.

Meet Qwen3.8-Max: A New Bar for Coding and Cowork. https://t.co/mJaA8vr6xT