
Moonshot AI · Launch Video Breakdown: Hook, Pacing & Motion Design
Kimi Slides handles the entire slide-building process: structure and research powered by Kimi K3, cohesive design with polished charts, editable and downloadable.
Scene-by-scene timeline & spoken transcript
The Hook
Introducing Kimi Slides: The AI-Powered Presentation Revolution
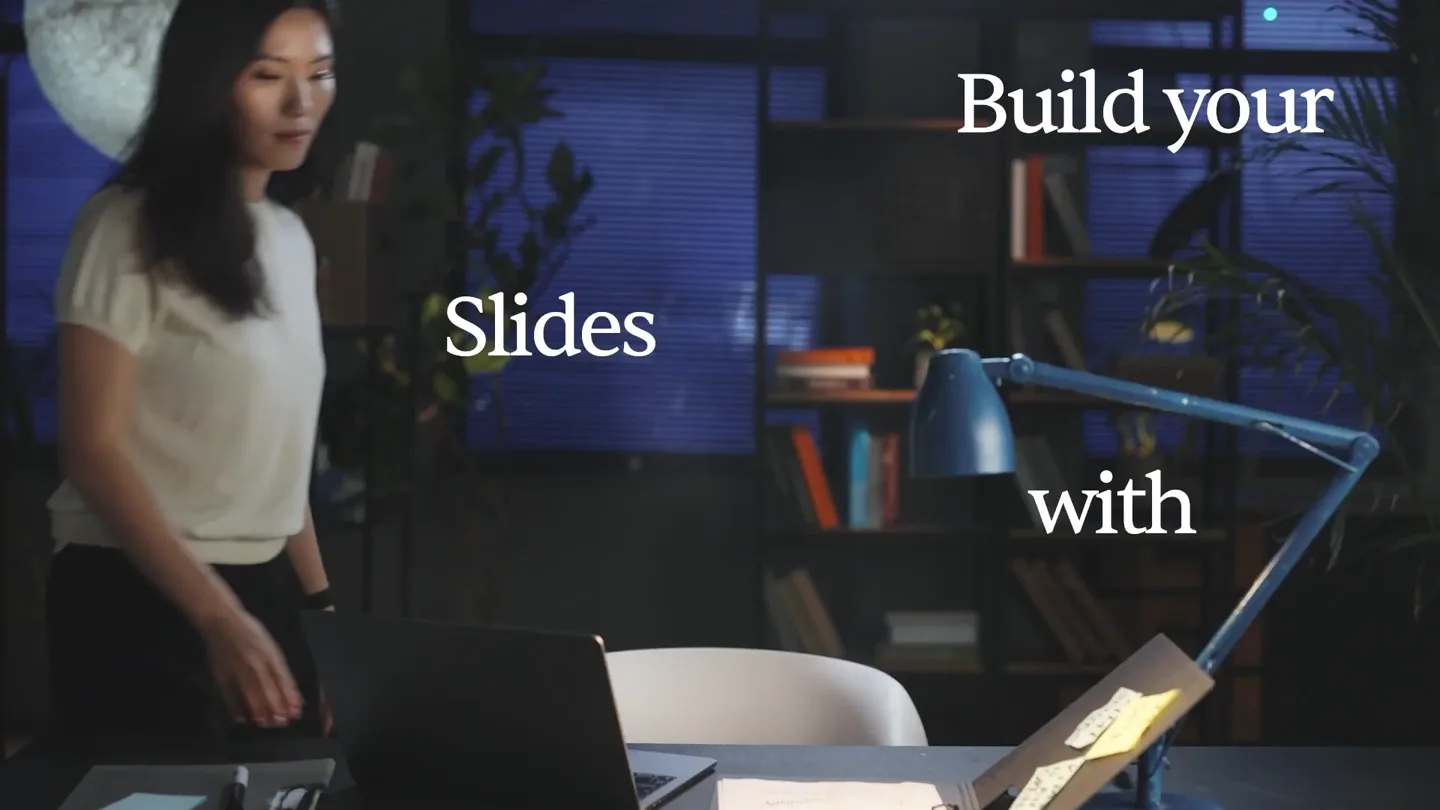
“Hi everyone, I'm Rachel from Kimi Global Team. Let's talk about Kimi Slides today. Building a presentable slide deck often involves a clear structure, cohesive design, and often several rounds of editing. This process can be time-consuming and tedious, from early research to the final edits. But what if AI could handle the entire slide-building process for you?”
- On screen
- Build your Slides with The Kimi Work Rachel Kimi Global Team Let's talk about Kimi Slides today A Presentable Slide Deck 01 Clear Structure Clear headline, clear flow. The audience gets the point in 3 seconds. Check: Do the section titles tell the full story? 02 Cohesive Design Consistent colors, type, layout, and visual language. Similar content looks similar. Check: Do all pages feel like one deck? 03 Several Rounds of Editing Clean layers, reusable styles, easy updates. No page-by-page rework. Check: Can someone else edit it quickly? PPT Methodology - One-Pager Edit Comment T Freestyle Create a McKinsey-style research deck on controlled nuclear fusion, titled "Controlled Nuclear Fusion: From Scientific Experiment to Energy Industry." Based on requirements.md and the attachments, analyze the industry's path from scientific validation to commercialization, including key opportunities, risks, and outlook. Use reliable public sources to fill data gaps. Ensure all charts, timelines, matrices, diagrams, and tables are edita K3 High Presentation Select project
- Camera
- Opens with a dynamic split-screen, then a medium shot of the presenter, transitioning to a screen capture of the Kimi Slides interface. The camera remains static on the presenter, while the UI elements animate.
- Motion
- Split-screen reveal, UI element pop-ins, text highlights, and smooth transitions between presenter and product UI. The initial split-screen uses a horizontal wipe. UI elements animate in with subtle bounces and fades.
Product Reveal
Kimi K3: Intelligent Structure & Design
“Kimi Slides, powered by Kimi K3, handles the entire slide-building process. It can then organize everything into a clear structure, from the table of contents to the appendix. It helps with formatting too, automatically generating polished charts and tables, or turn complex relationships into SmartArt. You can edit the data behind every charts, and Kimi will automatically update the chart for you. You can set the look and feel from the start, choosing from a variety of templates, or upload an PowerPoint Image or PDF as a reference, to keep the new deck consistent with your brand.”
- On screen
- 02 Contents At a glance Why now Technology landscape Value chain and bottlenecks Commercialization timeline Commercialization scenarios Competitive landscape Uncertainties and impediments Conclusions and implications SmartArt CHAPTER 2: TECHNOLOGY LANDSCAPE Six routes mapped by confinement principle x operating mode Position - Not category - carries the information: tokamak straddle the divide, and no inertial or compact route is steady-state yet STEADY-STATE (or steady-state goal) 3 STELLARATOR Steady-state, intrinsically steady-state - no disruptions METRICS: Type One Plasma Pressure DAY WEEK MONTH 1 TOKAMAK Golden age, most studied physics, pulsers today METRICS: Type One Plasma Pressure DAY WEEK MONTH INERTIAL Compact, pulsed, high-gain route MAGNETO-INERTIAL Compact, pulsed, high-gain route - no steady-state inertial route exists - power upgrade (~10 MW) is ultimately the defining gap - compact routes are inherently pulsed - repetitive or component life are the inherent engineering gap Foot Tag: 2-7 Small p-0.1 High - MED EARLY (US Nat. Academies) Read-through: The industry's near-term electricity bets sit in the pulsed column - steady-state remains the long-term, largely unfunded goal. Source: IEA World Fusion Outlook 2014, Fusion Energy Investment (priority: tokamaks need further investments (U.S. National Academies 2012), not company claims. Data Editing Shape Moving Smart Art Adjustment category S1 WHY NOW TECHNOLOGY VALUE CHAIN TIMELINE SCENARIOS LANDSCAPE RISKS IMPLICATIONS mark a new industry phase FORMATION FOLLOWS THE PHYSICS additions to cumulative private funding 2020 0.3 2021 2.8 2022 1.1 2023 0.9 2024 0.6 2025 1 6 2025 Cumulative private fusion companies Of companies (of 10+ demos) 3.0K since 2019 2019 2020 2021 2022 2023 2024 2025 Upgrade your plan KIMI Turn your ideas into stunning slides in minutes Slides Adaptive K3 High Select project All Consulting Finance Work Report Promotion Academic Freestyle Selected Annual Impact Summary Color Bars Documentary Moss Green Transformation 2025 Pine Green Strategy Sustainability and Social Impact Annual Report Fresh Brand Indigo Due Diligence THE GROUP KIMI Design PPTX 16.29 MB Turn the uploaded file to slides
- Camera
- Alternates between the presenter in a medium shot and full-screen product UI demonstrations. The UI shots often feature dynamic scrolling and element interactions.
- Motion
- Seamless UI demonstrations with animated data updates, template previews, and file upload simulations. Elements like charts and SmartArt animate into existence or transform, emphasizing the AI's capability. The presenter's gestures are synchronized with the on-screen actions.
Feature Teaser
AI-Powered Editing & Version Control
“Kimi can also rebuild complex technical diagrams, shapes, connectors, and formulas. If something does not work, you can always go back to previous versions. Kimi keeps track of all your edits, so you never lose your work.”
- On screen
- KIMI K3 8-Slide Deck Think Done - the cover now features a complete letter "K" I generated in the brand's dot-matrix style: hundreds of tiny characters ( 1, 0, #, @, *, +, K, A ) in deep navy #102E52 densely packed into a bold grotesque K letterform matching the logo, set on the guideline's light-blue #8ABFFA panel, with the same light-blue "echo" trails and scattered character fragments drifting at the edges as in the original brand artwork. The old cropped fragment was removed, and the deck passes validation cleanly. Open the updated file to preview the new cover alongside the rest of the deck. KIMI K3 KIMI K3 - Open Frontier Intelligen... Edit and download Edit Turn your ideas into stunning slides in minutes K3 Max AI-generated, for reference only KIMI K3 - Open Frontier Intellig... V1 Play Share Export 69% + Edit Comment T KIMI K3 Open Frontier Intelligence Replace the cover image with a "K" that has a similar visual effect. K3 Max AI-generated, for reference only 03 - AGENTIC CODING 300 Agents. 4,000 Steps. One Fluid Execution. KIMI K3 works the way an engineering team does: it plans, writes, tests, and revises across entire repositories for hours with minimal supervision - coordinating sub-agents and terminal tools in one continuous run. 42.0 SWE Marathon - #1 in ultra-long- horizon software engineering 77.8 Program Bench - #1 in end-to-end software development 88.3 Terminal-Bench 2.1 - within 0.5 of the top proprietary score 81.2 FrontiersSWE - frontier-level real repository tasks #1 Frontend Code Arena - 1,679 pts, ahead of both closed flagships remove cards, use thin separating lines instead. 04/08 KIMI KIMI K3 - Open Frontier Intelligen... V3 Latest Edited by Kimi at 2 min ago V2 Edited by Kimi at 22 min ago V1 Edited by Kimi at 50 min ago SMART CONNECTIONS GLOBAL SUMMARY FOR SMART CITY ADOPTION/MATURITY LEVELS OFFICIAL VARIABIES 01 EMERGENCY SERVICES/SAFETY 02 TRANSPORT NUMBER OF ACTIVE IOT CONNECTIONS IN EU SMART CITIES 10-15% 10% 30% 2020 20% 03 HEALTH 04 ENVIRONMENT 10-15% 10% 30% 20% RACONTELR Read page-1.page Adjust hb-cbl-0 label bounds to eliminate warning Edit slide page-1.page Think Execute Terminal Revalidates and screenshots final conver... Replace PPTX with PPTD and validate KIMI_REF path in san... Write Todo Done - I converted the uploaded PPTX to PPTD and replaced the previous smart_connections project in place. I also validated and re-rendered it successfully. SMART SMART CONNECTIONS Edit and download Turn your ideas into stunning slides in minutes K3 High
- Camera
- Focuses primarily on detailed UI interactions, showcasing AI-driven content generation, editing, and version history. The presenter appears in a picture-in-picture frame during some explanations.
- Motion
- Interactive UI elements, cursor animations, and dynamic content generation. Version history dropdowns animate smoothly, and complex diagrams rebuild themselves with a satisfying visual flourish. The picture-in-picture frame for the presenter is a clean, rounded rectangle.
Call to Action
Export & Expand: Kimi's Versatility
“Once you're finished export your work directly to PowerPoint, PDF, or even as images and social media cards. Kimi Slides is your all-in-one solution for creating stunning presentations with ease. Open Kimi Slides now and experience the future of slide building.”
- On screen
- Play Share Export X 50% + Build me a punk collage poster, yellow backdrop, hand lettering, halftones Qingpu Nature Society | Qingpu Coastal Wetland Park ANALYTICAL PRESENTATION This winter, the city comes closer to 120k migrating birds. Seven days by the date. Meet our coastal neighbors. 120K migratory birds 66 limited positions 10K visits Presented by Qingpu Nature Society 06/06 Build me a postcard where I can drop in a pixel art icon Trifold Build me a concert poster K KIMI
- Camera
- Transitions from UI demonstrations of export options and diverse output formats to a final medium shot of the presenter, concluding with the Kimi logo on a white background.
- Motion
- Animated export menus, dynamic previews of various output formats (PowerPoint, social media cards, posters). The final shot of the presenter is direct and engaging, followed by a clean, full-screen logo reveal with a subtle fade.
Motion design primitives
Synthesizable in Remotion · key components of the ai-productivity-launch-template template.
SplitScreenReveal
Two distinct video feeds or content blocks slide in from opposite sides (e.g., left and right) to meet in the center, creating a dynamic split-screen composition. Often used for an impactful opening or to contrast two elements.
+ Code construction recipe
Use `AbsoluteFill` for each content block. Animate `translateX` property from `-100%` to `0%` for the left block and `100%` to `0%` for the right block, using a `spring()` interpolation with a slight overshoot. Ensure `overflow: hidden` on the parent container.
UIDataPopIn
UI elements, such as charts, text blocks, or interactive components, appear on screen with a subtle scaling and fading animation, often accompanied by a slight bounce or overshoot to convey responsiveness.
+ Code construction recipe
Apply `interpolate()` to `scale` from `0.8` to `1` and `opacity` from `0` to `1`. Combine with `spring()` for a natural, bouncy feel. For sequential elements, use `delay` based on their order of appearance.
DynamicCursorInteraction
A virtual cursor moves across the screen, highlighting, clicking, or dragging UI elements to demonstrate product functionality, mimicking real user interaction.
+ Code construction recipe
Define a path for the cursor using `interpolate()` for `left` and `top` CSS properties. Use `Sequence` to chain multiple cursor movements and `AbsoluteFill` for the cursor SVG. Add `delay` for pauses and `durationInFrames` for movement speed. Simulate clicks with a quick scale down/up animation on the cursor and the clicked element.
Style DNA & aesthetic system
Visual aesthetic
Typography
Motion
Special effects
Pacing & rhythm
Conceptual story rhythm
- 1
The Pain Point & Promise
Purpose. Establish the common challenges of slide building and introduce Kimi Slides as the revolutionary solution.
Execution. Starts with a dynamic split-screen, then a direct address from the presenter, followed by UI shots illustrating the problem (manual editing, complex structure) and hinting at the AI solution.
- 2
Core Feature Showcase
Purpose. Demonstrate Kimi's primary capabilities: intelligent structure, design, and data integration.
Execution. Alternates between presenter explanations and detailed, animated UI walkthroughs showing Kimi generating content, formatting charts, and applying design templates seamlessly.
- 3
Advanced Capabilities & Control
Purpose. Highlight sophisticated features like AI-driven editing, version history, and brand consistency.
Execution. Focuses on intricate UI interactions, such as AI-guided content revisions, dynamic diagram rebuilding, and the version control system, often with the presenter in a picture-in-picture frame.
- 4
Versatility & Call to Action
Purpose. Emphasize the product's broad utility and encourage immediate adoption.
Execution. Showcases diverse export options and creative output formats, concluding with a direct call to action from the presenter and a clean brand logo reveal.
Remix in Animatiq Studio
Master remix prompt · agent-ready
Sample remix
Objective
Launch a new AI-powered data visualization platform called 'QuantumFlow' that simplifies complex data into interactive, shareable dashboards.How the recipe adapts
The SplitScreenReveal primitive would open with a 'before' (chaotic data) and 'after' (clean QuantumFlow dashboard). The UIDataPopIn primitive would be used extensively to animate complex charts and graphs appearing and transforming on the QuantumFlow interface. DynamicCursorInteraction would guide viewers through creating custom dashboards and applying AI-driven insights. The overall pacing and sound design would mirror the original, with energetic transitions marking new feature introductions, and the founder would explain the platform's benefits in a similar professional, informative tone.Remix blueprint · ai-productivity-launch-template
Scene durations (4 scenes, 123s)
Key Remotion components
Related Productivity Product Launches
Explore all Productivity launches →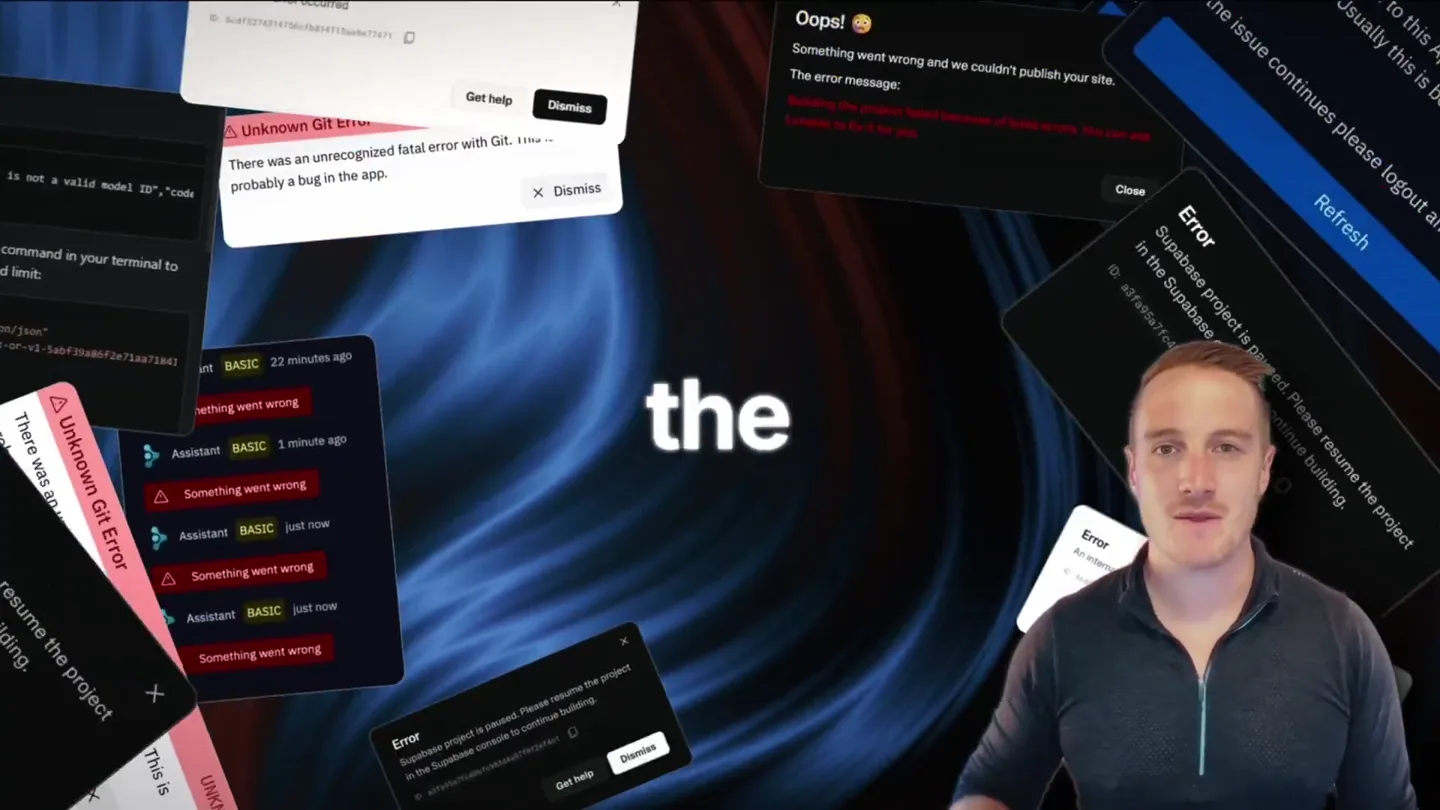
Bolt v2 pairs Claude Code and Codex agents with built-in hosting, database and storage so apps ship without setup.
Anthropic introduces Cowork, which brings the Claude Code way of delegating tasks to everyday, non-technical work.

Making life multiplanetary