
Perplexity · Launch Video Breakdown: Hook, Pacing & Motion Design
Starting today, all Perplexity users have access to SEC data across Search, Research, and Labs. Our new SEC/EDGAR integration provides direct access to comprehensive financial data for all investor…
Scene-by-scene timeline & spoken transcript
The Hook
Dynamic Data Visualization Intro
“(No spoken dialogue — A consistent, driving electronic beat with sub-bass and arpeggiated synth melodies builds anticipation.)”
- On screen
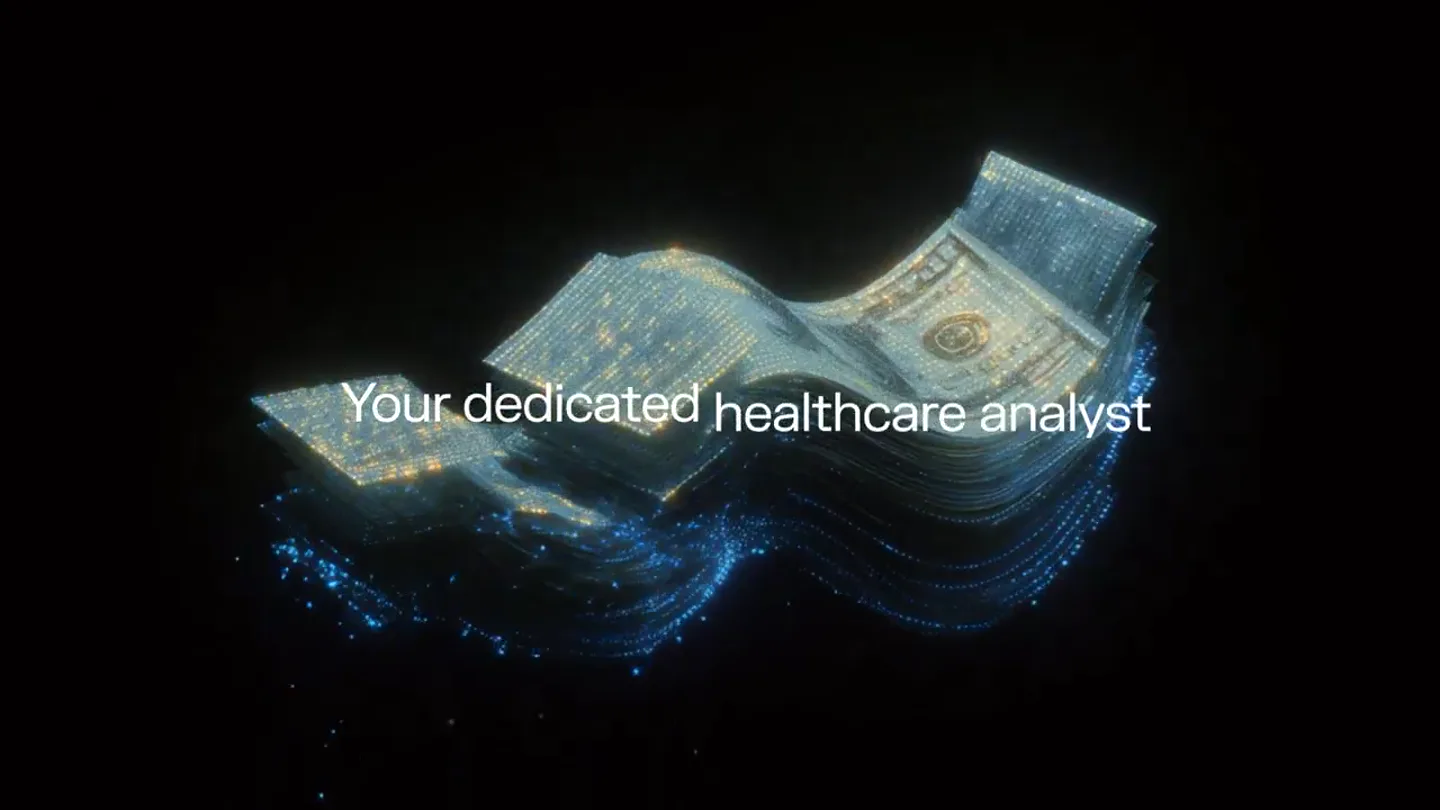
- Your dedicated marketing analyst Your dedicated financial analyst Search through SEC filings with Perplexity Labs
- Camera
- Medium shot, slightly angled, focusing on the undulating money stack. Camera slowly pans and rotates around the object.
- Motion
- 3D particle effects, glowing data trails, dynamic text reveal, object deformation (money stack waves).
Product Reveal
Perplexity Pro UI & Finance Integration
“(No spoken dialogue — The electronic beat continues, maintaining an energetic pace.)”
- On screen
- perplexity pro Create anything... Web Search across the entire Internet Academic Search academic papers Finance Search SEC filings Org files Search files from your organization My files Search my files More connectors I want to figure out which retailers have the highest correlation of same-store sales. Go through Walmart, Costco, Target, Dollar General, and create visualizations of their same-store sales over the last 8 quarters. Then run correlations on between each of those retailers, producing a heat map showing which has the highest correlation of same-store sales. Conclude your analysis by telling me whose sales are the most highly correlated 2 sources Python Programming retailer_correlation_matrix.csv Generated File retailer_same_store_sales_data.csv Generated File The code aims to improve the accuracy of time alignment by mapping specific months to their respective calendar quarters, enabling a more precise correlation analysis across different retailers and target data. This approach ensures that the quarterly data is correctly synchronized with actual calendar periods, leading to more meaningful insights into their relationships. Python Programming aligned_correlation_matrix.csv Generated File aligned_pivot_data.csv Generated File aligned_retailer_data.csv Generated File The chart is being created to visualize the quarterly same-store sales growth trends for four major retailers over the last 8 quarters, using the provided data. It will clearly show the performance of each retailer with different colored lines, include data labels for clarity, and feature a horizontal line at zero to indicate break-even points, all formatted as percentages for easy interpretation. Creating chart Quarterly same-store sales growth trends for major retailers from 2023-03 to 2025-02 Creating chart Correlation heatmap showing relationships between retailers' same-store sales performance The correlation heatmap is created to visually represent the relationships between the same-store sales of Walmart, Costco, Target, and Dollar General. It uses a diverging color scheme to clearly distinguish positive and negative correlations, with annotations of the correlation values for easy interpretation. The chart provides a comprehensive overview of how these retailers' sales performances are related. The strongest correlations emerge between specific retailer pairs, with both positive and negative relationships observed across the dataset. Same-Store Sales Correlation Matrix Correlation Walmart Costco Target Dollar General Retailer Correlation heat map showing relationships between same-store sales of Walmart, Costco, Target, and Dollar General Walmart and Target exhibit the highest correlation coefficient at -0.532, indicating a strong negative relationship where Walmart's stronger performance periods tend to coincide with Target's weaker performance 7 13. This inverse relationship suggests these retailers may be competing for similar customer segments or responding differently to market conditions. Walmart and Dollar General show the second-highest correlation at -0.506, another strong negative relationship 4 12 14. This pattern indicates that when Walmart performs well, Dollar General
- Camera
- Static, top-down view of the Perplexity Pro UI. Cursor interaction is animated.
- Motion
- UI animation, cursor interaction, text typing effect, smooth scrolling, data visualization (heatmap, charts) reveal.
Feature Teaser
SEC Filings & Change Analysis
“(No spoken dialogue — The electronic beat continues, with subtle synth variations.)”
- On screen
- Search through SEC filings with Perplexity Spaces Change Analysis in Filings Enter any company name and find out what is changing in their SEC filings over the last twelve months. TSLA change Context 2 sources Summary Table: Key Changes by Area Area Key Changes (2024-2025) Impact Source(s) Financial Performance Decline in US deliveries, legal settlement impacts, focus on AI/robotics Investor uncertainty, legal costs 3 13 17 Risk Factors More emphasis on competition, regulatory/litigation risk, less on supply chain Higher compliance/legal risk 15 17 Accounting Policies $31M reversal of stock comp, no restatements Affects net income/equity 13 17 Non-GAAP Measures No major changes in use or presentation Consistent reporting 15 16 18 Governance/Compliance New board member, compensation waivers, settlement implementation, SEC rule compliance Improved governance perception 13 14 Other Developments Major legal settlement, NJ charger replacement, ongoing FSD litigation, focus on AI/robotics Legal/regulatory risk, strategic repositioning 2 5 15 14 For detailed information, refer to: 2024 10-K (Jan 30, 2025) 17 Q1 2025 10-Q (Apr 23, 2025) 18
- Camera
- Similar to the hook, a medium shot of the undulating money stack, then a static top-down view of the UI.
- Motion
- 3D particle effects, glowing data trails, dynamic text reveal, UI animation, text typing effect, smooth scrolling.
Call to Action
Perplexity Finance & Brand Outro
“(No spoken dialogue — The electronic beat intensifies with a riser and sub-bass drop/impact at 0:39, leading to a clean, modern, and energetic conclusion.)”
- On screen
- Perplexity Finance. For the curious investors. PERPLEXITY.COM WHERE KNOWLEDGE BEGINS WHERE KNOWLEDGE BEGINS PERPLEXITY.COM
- Camera
- Medium shot of the money stack with a glowing data graph, then a full screen black background with a white line-art logo and text.
- Motion
- 3D particle effects, glowing data graph, text fade-in, logo animation (line-art drawing), subtle background glow.
Motion design primitives
Synthesizable in Remotion · key components of the ai-finance-launch-template template.
UndulatingDataStack
A stack of dollar bills deforms and undulates, covered in glowing blue and yellow particles that trace its surface and emanate from it, suggesting data flow.
+ Code construction recipe
Utilize a 3D model of a money stack. Apply a noise or wave modifier to its geometry for the undulating effect. Implement a particle system (e.g., Three.js or R3F) to generate glowing particles, with their positions constrained to the mesh surface and animated to flow along it. Use a shader for the glowing effect on particles and subtle reflections on the money.
DynamicUITextReveal
Text appears character by character as if being typed, often accompanied by a blinking cursor, within a clean, dark-themed UI.
+ Code construction recipe
Employ `Sequence` and `spring` or `interpolate` for character-by-character text reveal. Use `measureText` to calculate text width for cursor positioning. A simple `opacity` and `translateX` animation can be applied to each character. The blinking cursor can be a simple `opacity` loop.
InteractiveDataVizScroll
A user interface scrolls smoothly through complex data visualizations like heatmaps and detailed text analyses, with a cursor highlighting interactive elements.
+ Code construction recipe
Create a scrollable container component. Animate the `scrollTop` property using `spring` or `interpolate` for smooth scrolling. Implement cursor movement with `spring` to follow a predefined path, simulating user interaction. Data visualizations can be rendered as static images or dynamically generated SVG/Canvas elements, fading in as they enter the viewport.
Style DNA & aesthetic system
Visual aesthetic
Typography
Motion
Special effects
Pacing & rhythm
Conceptual story rhythm
- 1
Abstract Problem/Solution
Purpose. To visually represent the complexity of financial data and the AI's ability to process it, setting the stage for the product's value proposition.
Execution. Undulating money stack with glowing data particles, accompanied by text highlighting the challenge and initial solution.
- 2
Product in Action
Purpose. To demonstrate the intuitive user interface and the seamless integration of SEC data search and analysis.
Execution. Detailed UI walkthrough showing query input, finance data source selection, and the generation of complex reports and visualizations.
- 3
Specific Use Case Highlight
Purpose. To showcase a powerful, specific feature (Change Analysis) that directly addresses a common investor need.
Execution. Demonstration of the 'Change Analysis in Filings' feature, showing how to quickly identify key changes in a company's SEC documents.
- 4
Brand Reinforcement & CTA
Purpose. To solidify the brand's identity in the finance sector and prompt users to explore further.
Execution. Return to the abstract money/data visualization, a clear tagline, and a final brand logo reveal with website URL.
Remix in Animatiq Studio
Master remix prompt · agent-ready
Sample remix
Objective
Launch an AI platform for medical diagnostics that integrates patient data, research papers, and clinical trials.How the recipe adapts
The UndulatingDataStack primitive would be adapted to show a flowing stream of medical records or DNA strands, with glowing particles representing diagnostic insights. The DynamicUITextReveal would showcase queries like 'Diagnose rare genetic disorder based on symptoms and genomic data.' The InteractiveDataVizScroll would display interactive charts of patient cohorts, drug efficacy heatmaps, and research paper citations. The color palette would shift to include more greens and blues, maintaining the dark mode. The overall pacing and energetic audio would remain, emphasizing the speed and precision of AI in medicine.Remix blueprint · ai-finance-launch-template
Scene durations (4 scenes, 44s)
Key Remotion components
Related Tech & SaaS Product Launches
Explore all Tech & SaaS launches →
Unreal Engine 6 has been announced with Rocket League.

announcing @cluely's $15M fundraise, led by @a16z. cheat on everything.
Yesterday we launched Bouncer to put users in control of their Twitter feed. Today, we open sourced the Chrome extension. We believe software should align with your interests, not the company that…