
Animesh Koratana · Launch Video Breakdown: Hook, Pacing & Motion Design
Introducing: PlayerZero The world's first Engineering World Model that puts debugging, fixing, and testing your code on autopilot. We've raised $20M from Foundation Capital, @matei_zaharia (Databri…
Scene-by-scene timeline & spoken transcript
The Hook
The Problem with Traditional Engineering
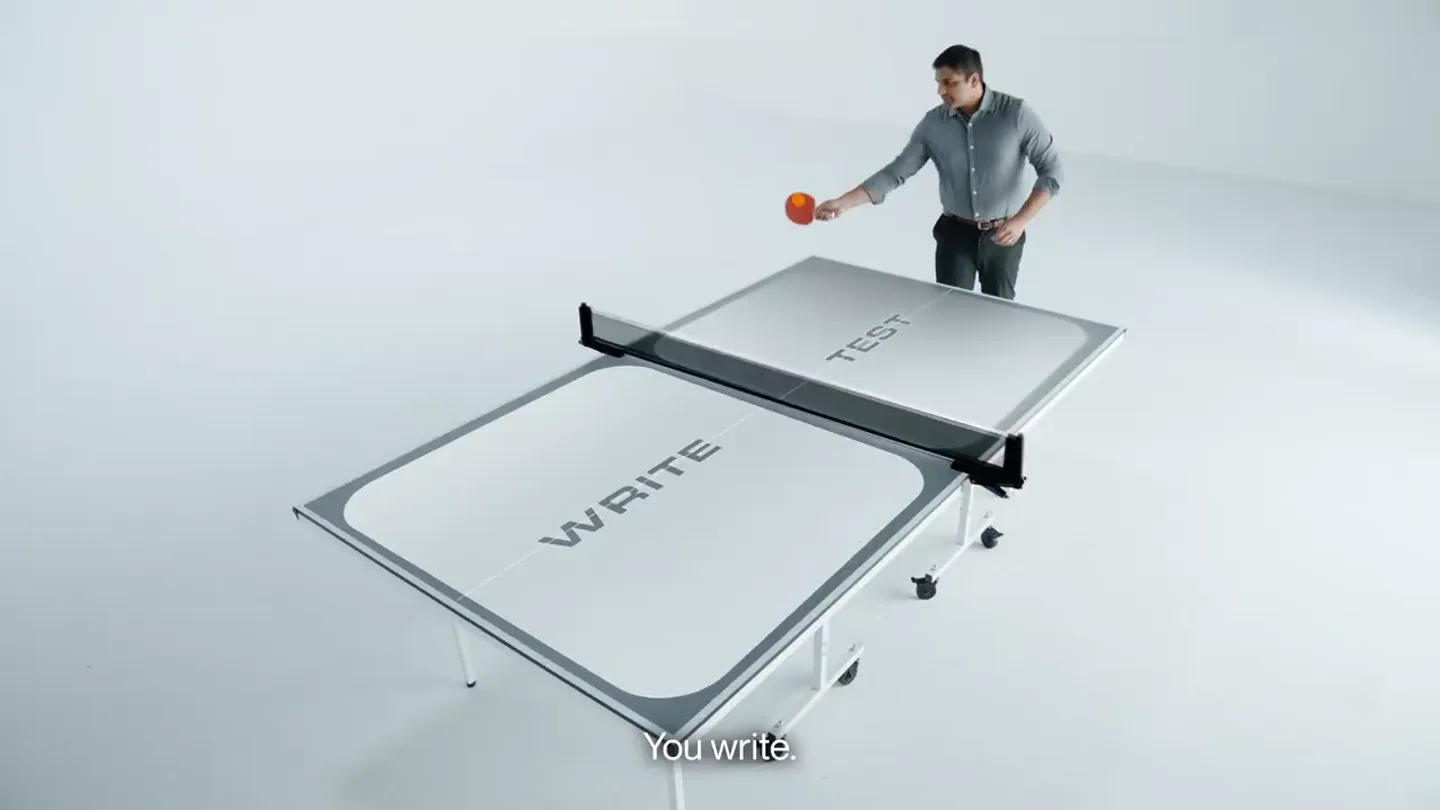
“But our ability to test and debug it, that hasn't changed. at Fortune 500s are being spent on debugging and testing.”
- On screen
- WRITE, TEST, Writing code, Testing and debugging
- Camera
- Overhead shot of a ping-pong table, then medium shot of the presenter, followed by a wide shot with a graphic overlay, then a medium shot with large background text.
- Motion
- Split-screen concept using a ping-pong table, animated pie chart reveal, and large, fading background text for emphasis.
Problem Agitation
The Cost of Manual Debugging
“Your team just shipped 'Design with your voice'. Your engineering team would take days to find the root cause. At the heart of PlayerZero, Think of it as packaging the collective knowledge of your entire engineering team”
- On screen
- (No on-screen text)
- Camera
- Close-up on a monitor, then wide shot of engineers in an office setting with floating chat bubbles, then medium shot of the presenter.
- Motion
- Animated chat bubbles appearing and fading, simulating a chaotic communication flow. Subtle camera push-ins and pull-outs.
Product Reveal
Introducing PlayerZero: The Engineering World Model
“So when the Japanese Voice Mode issues hit, the World Model connects the dots. it writes the fix, and sends it to the right engineer for approval. knowledge of how your system works is siloed in different people's brains. PlayerZero reduces the resolution time for issues by 90%”
- On screen
- Wiring in safeguards so this doesn't repeat, 90%
- Camera
- Medium shot of a monitor displaying a text box, then a medium shot of the presenter with a large '90%' graphic in the background.
- Motion
- Text box animation with a typing effect, followed by a large, bold percentage graphic appearing with a subtle zoom and fade.
Feature Teaser
Automated Testing and Simulation
“Engineers would spend a thousand hours trying to break Voice Mode with edge cases. Imagine a team of 30 engineers doing this 100 times a week for every new feature. The Engineering World Model turns this upside-down. that did or didn't go wrong. the most accurate production engineer in existence, making tests obsolete.”
- On screen
- Simulation
- Camera
- Wide shot of engineers, then medium shot of the presenter, followed by a graphic of a connected sphere with data points and a list of simulation results.
- Motion
- Animated sphere with connecting lines and nodes, simulating a network or data model. List items appearing with checkmarks.
Call to Action
Results, Offer, and Giveaway
“Zuora and Nylas catch bugs right from Day 1. If you book a demo today and we can't increase resolution speed. We're also giving away a collection of 100 Claude Skills”
- On screen
- ZUORA, GP Georgia-Pacific, nylas, 95% reduction in escalations, 5x faster ticket resolution, 8x faster incident resolution, *Only for qualifying enterprise customers, cli-developer.md, cloud-architect.md, cloudflare-manager.md, containerize-application.md, deploy-checklist.md, devops-engineer.md, devops-setup.md, docker-generator.md, docker-optimize.md, env-configurator.md, hotfix-deploy.md, k8s-manifest.md, kubernetes-specialist.md, PLAYERZERO
- Camera
- Wide shot of logos and statistics, then medium shot of the presenter with a list of files in the background, ending on the company logo.
- Motion
- Logos and statistics appearing with a subtle fade-in and scale. File list scrolling up behind the presenter. Final logo reveal with a clean fade.
Motion design primitives
Synthesizable in Remotion · key components of the engineering-world-model-launch template.
SplitScreenConceptReveal
A scene starts with a wide shot of a physical object (e.g., a ping-pong table) divided into two conceptual halves, each labeled with a key term. The camera then cuts to a presenter, and a graphic overlay appears, visually representing the division with an animated pie chart.
+ Code construction recipe
Use `AbsoluteFill` for background, `Img` for the physical object. Overlay `AbsoluteFill` with `Path` or `Svg` for the pie chart, animating `strokeDashoffset` or `transform` properties. Text labels use `spring` for entry animation.
FloatingChatBubbleAgitation
Multiple semi-transparent chat bubbles with text content float and subtly animate around a scene, often in an office setting with people. They appear and disappear, simulating a busy, potentially chaotic communication environment.
+ Code construction recipe
Create `AbsoluteFill` components for each chat bubble. Use `interpolate` with `random` values for `x`, `y` positions, `opacity`, and `scale` to simulate floating and fading. Apply `blur` or `dropShadow` CSS filters for depth.
DataNetworkSphereSimulation
A 3D sphere composed of interconnected nodes and lines rotates and pulses, with various colored data points (squares, circles, triangles) appearing and disappearing on its surface. This visualizes complex data relationships or system simulations.
+ Code construction recipe
Implement using `ThreeCanvas` for a 3D sphere. Nodes and lines can be `Mesh` or `Line` objects. Animate `rotation` and `scale` of the sphere. Data points can be `Sprite` or `Mesh` objects with `opacity` and `position` animated using `spring` or `interpolate`.
Style DNA & aesthetic system
Visual aesthetic
Typography
Motion
Special effects
Pacing & rhythm
Conceptual story rhythm
- 1
The Status Quo
Purpose. Establish the current, inefficient state of engineering processes, particularly debugging and testing, to create a relatable problem for the audience.
Execution. The ping-pong table metaphor visually divides 'write' and 'test', followed by a pie chart graphic illustrating the disproportionate time spent on debugging.
- 2
The Pain Point
Purpose. Agitate the problem by showing the real-world consequences and frustrations engineers face with manual, time-consuming debugging.
Execution. Scenes of engineers in a chaotic environment with floating chat bubbles representing communication overload and the difficulty of finding root causes.
- 3
The Solution
Purpose. Introduce PlayerZero as the revolutionary solution, explaining its core mechanism (Engineering World Model) and immediate benefits.
Execution. The reveal of the '90%' reduction in resolution time, followed by the animated data network sphere visualizing the World Model's intelligence.
- 4
The Transformation
Purpose. Demonstrate the tangible impact and future potential of PlayerZero, showcasing success metrics and a compelling call to action.
Execution. Client logos with impressive statistics, a promotional offer, and a giveaway, culminating in a clear brand logo reveal.
Remix in Animatiq Studio
Master remix prompt · agent-ready
Sample remix
Objective
Launch a new AI-powered financial analysis platform that automates market research and portfolio optimization.How the recipe adapts
The split-screen concept can illustrate 'Manual Research' vs. 'AI Analysis'. A dynamic pie chart can show time saved. The data network sphere can be adapted to visualize interconnected market data points and investment strategies. Large, bold numbers will highlight ROI percentages and efficiency gains. The vibrant accent color will be a deep blue, contrasting with the white background. The presenter will interact with animated stock charts and data streams in the background.Remix blueprint · engineering-world-model-launch
Scene durations (5 scenes, 173s)
Key Remotion components
Related Creative Tools Product Launches
Explore all Creative Tools launches →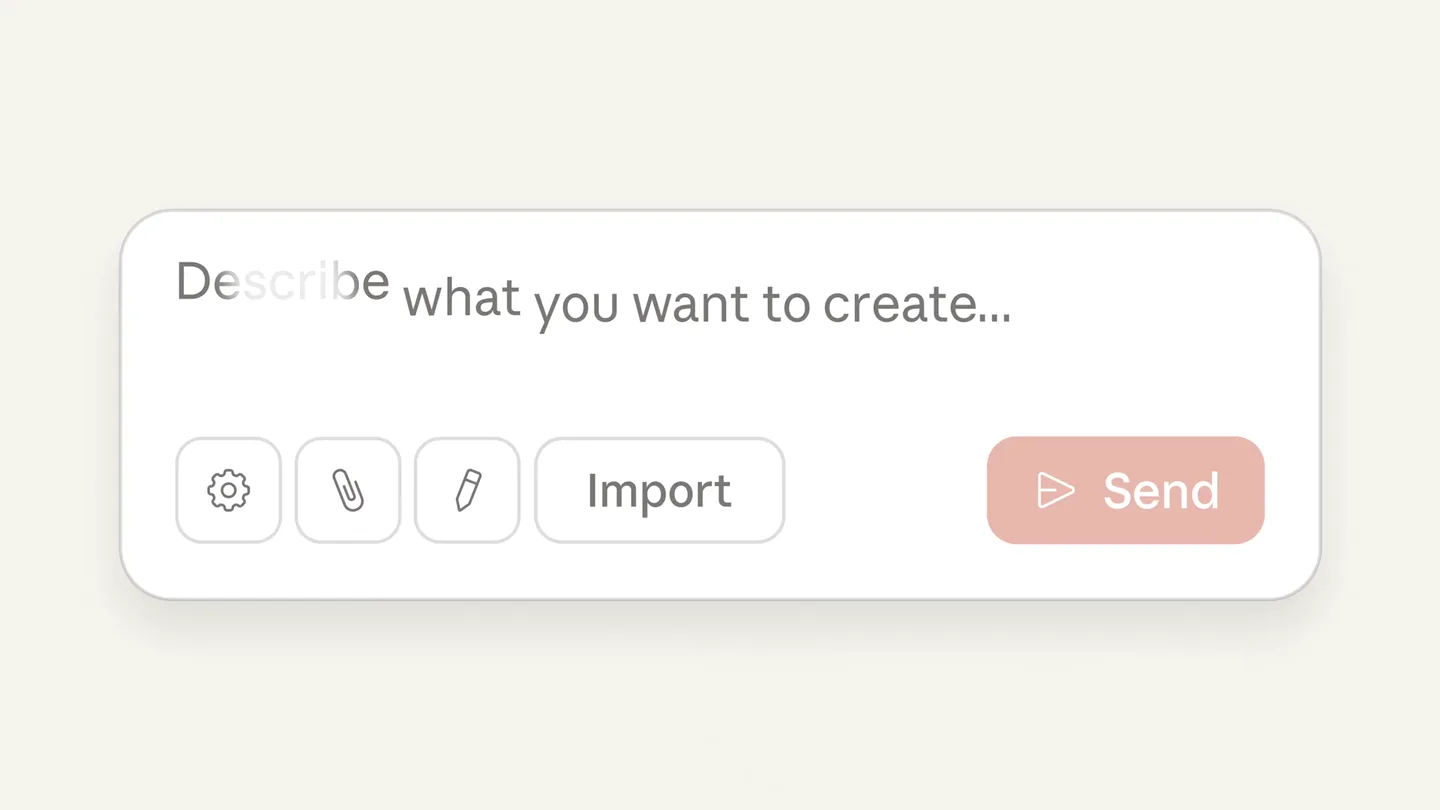
Anthropic Labs launches Claude Design, which turns conversation into prototypes, slides and one-pagers, powered by Claude Opus 4.7.
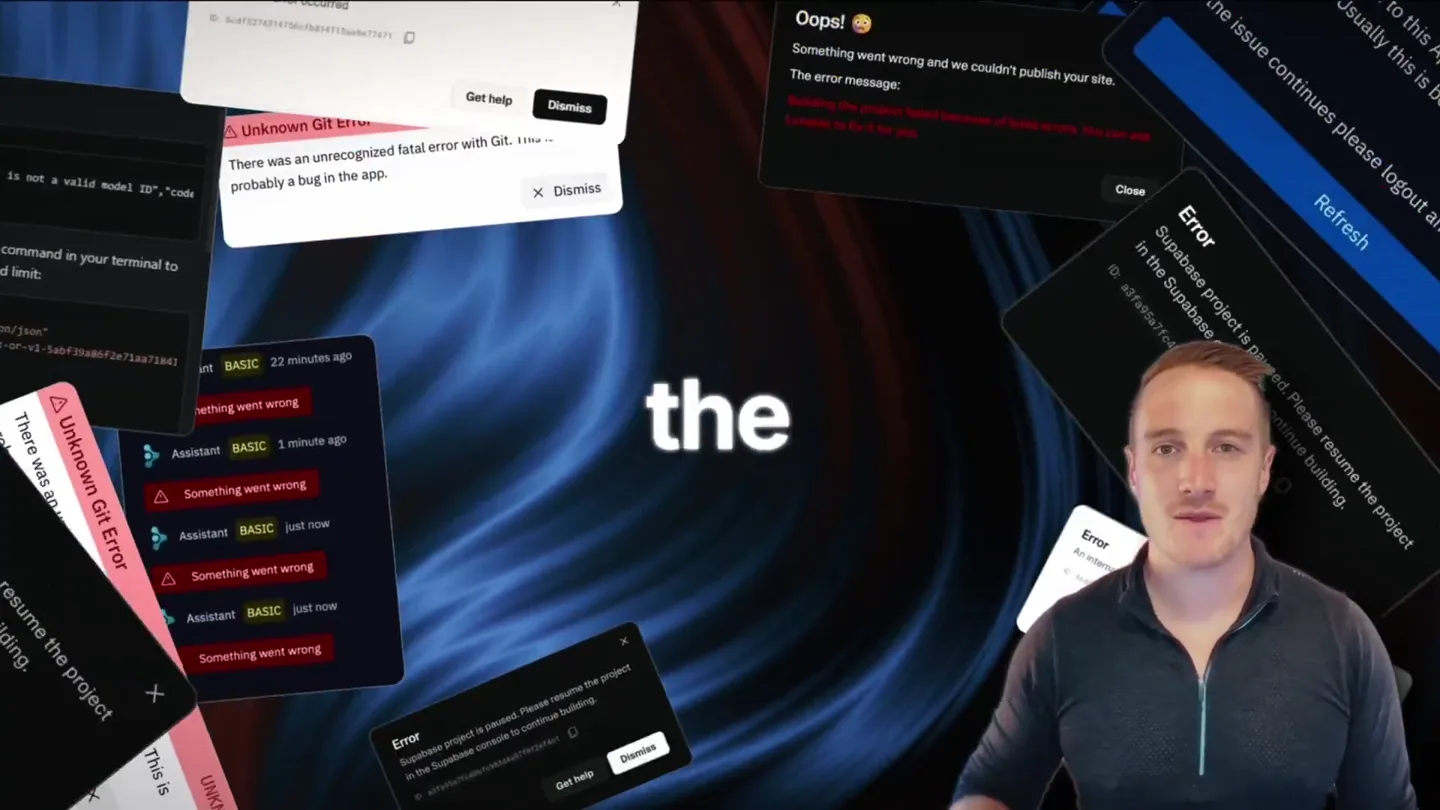
Bolt v2 pairs Claude Code and Codex agents with built-in hosting, database and storage so apps ship without setup.

Making life multiplanetary