
Pulse · Launch Video Breakdown: Hook, Pacing & Motion Design
Pulse is a Mac app for seeing what’s slowing your Mac down and what’s taking space: live resource graphs, app activity, disk storage, and saved snapshots. History stays on the Mac.
Scene-by-scene timeline & spoken transcript
The Hook
Live Resource Graphs & App Activity
“(No spoken dialogue — Ambient electronic score with pizzicato synths and sub-bass, building intensity with a high-energy audio transition.)”
- On screen
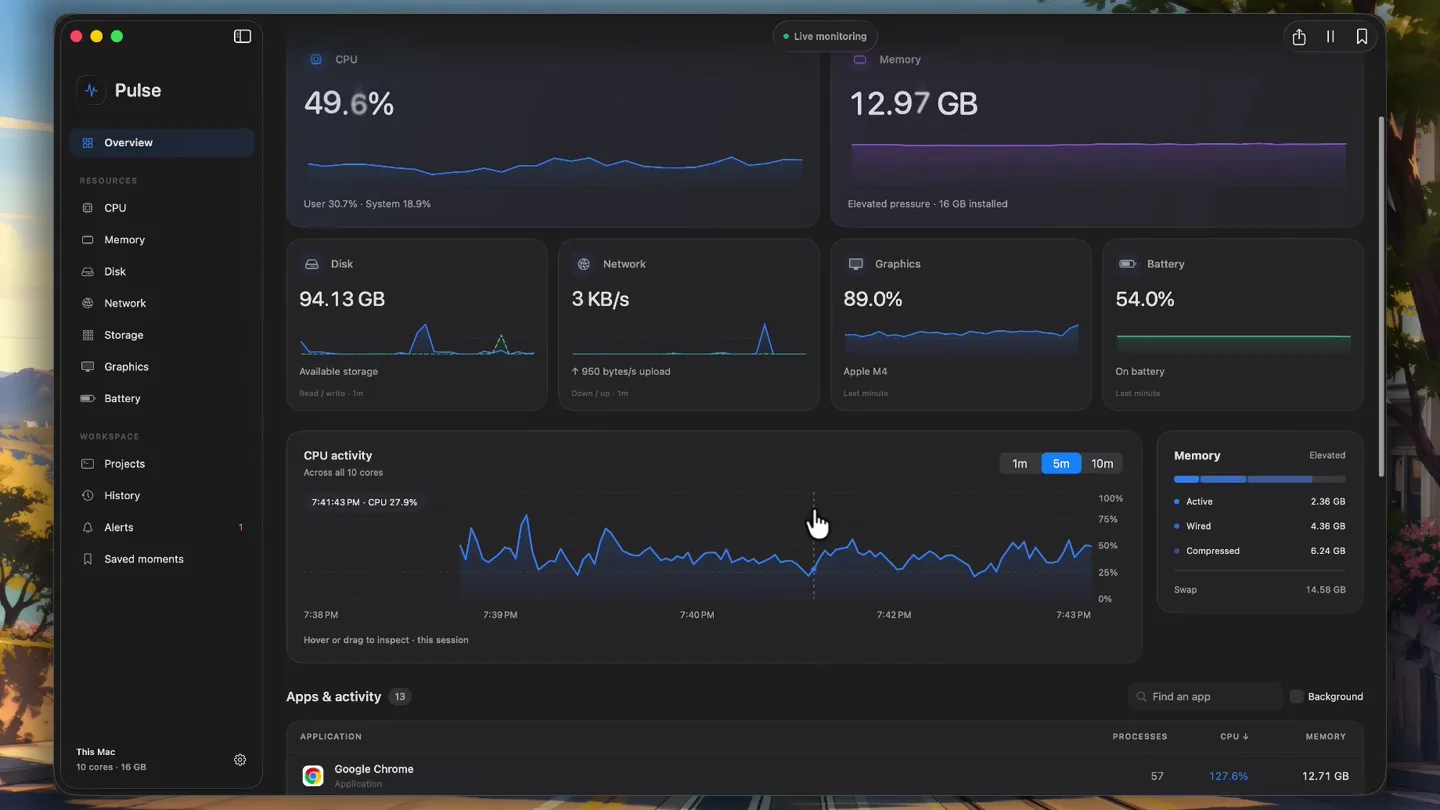
- Pulse Overview Your Mac, at a glance. CPU 50.5% User 29.4% - System 21.1% Disk 94.13 GB Available storage Network 5 KB/s ↑ 2 KB/s upload Download - Upload Graphics 79.0% Apple M4 Battery 54.0% On battery Last minute CPU activity Across all 10 cores 1m 5m 10m 100% 75% 50% 25% 0% 7:38 PM 7:39 PM 7:40 PM 7:41 PM 7:42 PM 7:43 PM 7:44 PM Hover or drag to inspect - this session Memory 12.88 GB Elevated pressure - 16 GB installed Memory Elevated Active 2.48 GB Wired 4.47 GB Compressed 6.17 GB Swap 14.68 GB Live monitoring Normal Overview CPU Memory Disk Network Storage Graphics Battery WORKSPACE Projects History Alerts Saved moments This Mac 10 cores - 16 GB Apps & activity 13 APPLICATION PROCESSES CPU MEMORY Google Chrome Application 57 173.2% 12.7 GB Brave Browser Application 19 95.7% 5.38 GB Pulse Application 1 50.7% 245.4 MB ChatGPT Application 38 26.5% 4.02 GB Cap Application 4 12.1% 93.6 MB Zed Application 43 6.8% 5.4 GB OpenUsage Application 1 0.3% 121.2 MB Slack Application 7 0.3% 896.1 MB Maccy Application 1 0.1% 382.7 MB Ghostty Application 1 0.0% 193.5 MB Find an app Background
- Camera
- Static wide shot of the Pulse app interface on a Mac desktop, showcasing various live resource graphs and app activity. The camera subtly zooms in on specific UI elements as the cursor interacts.
- Motion
- UI element highlighting via cursor interaction, smooth transitions between data views, and subtle background parallax scrolling.
Feature Teaser
Deep Dive into Mac Performance Metrics
“(No spoken dialogue — The electronic score continues, maintaining a dynamic and suspenseful tone with subtle sound design elements accompanying UI interactions.)”
- On screen
- Pulse Overview Your Mac, at a glance. CPU 50.5% User 29.4% - System 21.1% Disk 94.13 GB Available storage Network 5 KB/s ↑ 2 KB/s upload Download - Upload Graphics 79.0% Apple M4 Battery 54.0% On battery Last minute CPU activity Across all 10 cores 1m 5m 10m 100% 75% 50% 25% 0% 7:38 PM 7:39 PM 7:40 PM 7:41 PM 7:42 PM 7:43 PM 7:44 PM Hover or drag to inspect - this session Memory 12.88 GB Elevated pressure - 16 GB installed Memory Elevated Active 2.48 GB Wired 4.47 GB Compressed 6.17 GB Swap 14.68 GB Live monitoring Normal Overview CPU Memory Disk Network Storage Graphics Battery WORKSPACE Projects History Alerts Saved moments This Mac 10 cores - 16 GB Apps & activity 13 APPLICATION PROCESSES CPU MEMORY Google Chrome Application 57 173.2% 12.7 GB Brave Browser Application 19 95.7% 5.38 GB Pulse Application 1 50.7% 245.4 MB ChatGPT Application 38 26.5% 4.02 GB Cap Application 4 12.1% 93.6 MB Zed Application 43 6.8% 5.4 GB OpenUsage Application 1 0.3% 121.2 MB Slack Application 7 0.3% 896.1 MB Maccy Application 1 0.1% 382.7 MB Ghostty Application 1 0.0% 193.5 MB Find an app Background CPU Processor activity, with every helper included. CPU activity Now 45.2% Sample average 41.1% Peak 78.5% CPU Total CPU 45.2% User 29.8% System 15.5% 1-minute load 5.72 Apps & activity 13 APPLICATION PROCESSES CPU MEMORY Google Chrome Application 57 148.6% 12.71 GB Pulse Application 1 37.6% 206 MB ChatGPT Application 38 23.2% 4.02 GB Cap Application 4 21.1% 96 MB Brave Browser Application 19 16.1% 5.38 GB Memory Memory activity Now 80.4% Sample average 79.3% Peak 82.0% Memory Working memory 12.87 GB Pressure Elevated Swap 14.56 GB Memory Elevated Active 2.48 GB Wired 4.42 GB Compressed 5.98 GB Swap 14.56 GB Apps & activity 13 APPLICATION PROCESSES CPU MEMORY Google Chrome Application 57 162.4% 12.72 GB Zed Application 43 8.6% 5.4 GB Brave Browser Application 19 23.3% 5.38 GB Disk Storage capacity and live read/write activity. Disk activity Disk read 18.4 MB/s Disk write 1.8 MB/s Sample average 20.4 MB/s Peak 171.8 MB/s Disk read Disk write Reading 18.4 MB/s Writing 1.8 MB/s Mounted volumes 1 Storage Macintosh HD 94.12 GB available of 460.4 GB APPS volumes may share container capacity; their totals should not be added together. App disk activity 13 APPLICATION PROCESSES READ /S WRITE /S Cap Application 4 0 B/s 939 KB/s Brave Browser Application 19 0 B/s 0 B/s Calendar Application 1 0 B/s 0 B/s ChatGPT Application 38 150 KB/s 0 B/s Ghostty Application 1 0 B/s 0 B/s Google Chrome Application 57 59 KB/s 0 B/s Maccy Application 1 0 B/s 0 B/s Network Traffic across your active network interfaces. Network activity Download 12 KB/s Upload 3 KB/s Sample average 32 KB/s Peak 1.9 MB/s Download Upload Download 1 KB/s Upload 3 KB/s Active interfaces 22 Interfaces INTERFACE DOWNLOAD UPLOAD anp0 Virtual / tunnel interface 0 B/s 0 B/s anp1 Virtual / tunnel interface 0 B/s 0 B/s anp3 Virtual / tunnel interface 0 B/s 0 B/s ap1 Virtual / tunnel interface 0 B/s 0 B/s awdl0 Virtual / tunnel interface 0 B/s 0 B/s bridge0 Virtual / tunnel interface 0 B/s 0 B/s en0 Physical interface 13 KB/s 1 KB/s Graphics Graphics activity reported by this Mac. Graphics activity Now 95.0% Sample average 69.5% Peak 96.0% GPU GPU activity 95.0% Reported memory 1.19 GB Thermal state Normal Apple M4 Live device utilization reported by the graphics driver. GPU memory is a driver-reported figure, not additional physical RAM. Per-app GPU attribution is not available. Local & private Live: 2 second refresh Storage Applications /Applications 23.18 GB private /Users/stenci/.private 17.84 GB Partial access Caches /Users/stenci/Library/Caches 15.01 GB Partial access Developer /Library/Developer 13.4 GB tracewell /Users/stenci/Desktop/personal-projects/pulse/apps/web 13.3 GB Android /Users/stenci/Library/Android 12.52 GB beui-pro /Users/stenci/Desktop/personal-projects/beui-pro 10.79 GB .bun /Users/stenci/.bun 10.43 GB .android /Users/stenci/.android 7.48 GB .codex /Users/stenci/.codex 6.07 GB Update pending Containers /Users/stenci/Library/Containers 6.02 GB Partial access createos-studio /Users/stenci/Desktop/work/createos-studio 5.66 GB .cache /Users/stenci/.cache 4.94 GB Projects Local runtimes, grouped by their working folder. Listening TCP ports - refreshes every 10 seconds Finding local projects... Include runtimes without ports web /Users/stenci/Desktop/personal-projects/pulse/apps/web node PID 16,505 - 4183 853.8 MB Reveal api /Users/stenci/Desktop/personal-projects/pulse/apps/api node PID 32,913 - 48918, 49320 179 MB Reveal redis /opt/homebrew/var/db/redis redis-server PID 6,426 - 6379 7 MB Reveal Folders reflect the process working directory, not a detected Git root. Low CPU alone does not prove that a server is safe to stop. Local & private Live: 2 second refresh History Thirty days of measurements, stored on this Mac. History period 12 hours 24 hours 7 days 30 days Metric CPU CPU activity 217 displayed samples 100% 75% 50% 25% 0% 7:44 AM 10:44 AM 1:44 PM 4:44 PM 7:44 PM 27 Sep 2026 at 7:44:01 PM Apps at the selected time Google Chrome 175.4% 12.83 GB Brave Browser 81.0% 5.33 GB Cap 30.9% 88.4 MB ChatGPT 27.1% 3.97 GB Pulse 25.0% 264.6 MB Zed 9.3% 5.4 GB Slack 1.0% 897.9 MB OpenUsage 0.4% 121.2 MB Maccy 0.1% 382.7 MB Pinterest 0.1% 35.9 MB Ghostty 0.0% 193.5 MB Calendar 0.0% 15.9 MB One sample per minute while Pulse is running. Longer ranges show representative samples, not averages. No measurements are recorded while paused, asleep, or quit. Alerts Sustained activity that may need your attention. This session Configure alerts Google Chrome is using sustained CPU Above 80% of one core for at least 120 seconds. 141ms Local & private Live: 2 second refresh Pulse Settings Updates Installed version 0.1.0 (1) Automatically check for updates Check for Updates... Updates will be available when the release feed is connected. License Status Development build Activation sends your license and a random installation ID. Your measurements are never uploaded. Monitoring While visible Every 2 seconds While hidden Every 10 seconds Saved-moment capture uses a 2-second interval. History records one sample per minute for up to 30 days. Open Pulse at login Menu bar Metric CPU Appearance Figure Finder...
- Camera
- The camera remains static, focusing on the Pulse app. The cursor navigates through the sidebar, clicking on 'CPU', 'Memory', 'Disk', 'Network', 'Graphics', 'Storage', 'Projects', 'History', and 'Alerts', revealing detailed information for each section. A settings modal briefly appears.
- Motion
- Rapid, precise cursor movements and instant UI panel transitions. The interaction is fluid, demonstrating the app's responsiveness and comprehensive data display. A subtle modal pop-up animation.
Product Reveal
Pulse: Your Mac's Performance Unveiled
“(No spoken dialogue — The electronic score intensifies with a sub-bass drop and impactful sound design, creating a sense of revelation and power.)”
- On screen
- (No on-screen text)
- Camera
- Dynamic, abstract camera movements through a dark, digital environment. The perspective shifts rapidly, showcasing glowing lines and geometric shapes, hinting at data flow and system internals.
- Motion
- Fast-paced abstract motion graphics, glowing lines, particle effects, and volumetric lighting. The camera navigates through a complex, data-driven landscape with quick cuts and sweeping movements.
Feature Teaser
Visualizing System Health & Data Flow
“(No spoken dialogue — The score maintains its dynamic energy, with rhythmic synth patterns and percussive elements driving the visual narrative.)”
- On screen
- (No on-screen text)
- Camera
- Continued abstract camera movements, focusing on intricate digital patterns and data visualizations. The camera often follows glowing lines or sweeps across complex network-like structures.
- Motion
- Procedural generation of abstract data visualizations, glowing particle trails, and dynamic light streaks. The motion is fluid and continuous, emphasizing interconnectedness and real-time data processing.
Call to Action
Pulse: Understand Your Mac
“(No spoken dialogue — The audio track builds to a powerful crescendo with a final sub-bass impact, then fades out with lingering ambient tones.)”
- On screen
- (No on-screen text)
- Camera
- The abstract camera movements become more focused, leading to a final reveal of the Pulse logo or a stylized representation of the app. The camera pulls back to show a broader, more resolved view of the digital landscape.
- Motion
- Climax of abstract motion graphics, culminating in a clear brand identity reveal. Smooth camera pull-back, subtle lens flares, and a final, impactful visual transition.
Motion design primitives
Synthesizable in Remotion · key components of the pulse-inspired-data-flow-launch template.
UIDataGraphReveal
A UI element, such as a graph or data panel, smoothly animates into view or updates its data points with a subtle, organic growth effect. Cursor interaction highlights specific data points or sections.
+ Code construction recipe
Use `interpolate` for opacity and scale transitions. Implement `spring` for subtle bounce on element appearance. SVG path animations for graph lines, using `stroke-dasharray` and `stroke-dashoffset` to draw them on. Cursor interaction can trigger `useState` updates for data highlighting.
AbstractDataFlow
Glowing lines and particles move dynamically through a dark, three-dimensional space, forming complex network-like structures or data streams. The camera navigates through this environment.
+ Code construction recipe
Utilize Remotion's `Canvas` or `Three.js` integration for particle systems and volumetric lighting. Implement `interpolate` for particle movement along splines. Use `Shader` components for glowing effects and procedural generation of lines. Camera movement can be controlled via `spring` or `interpolate` on position and rotation.
Style DNA & aesthetic system
Visual aesthetic
Typography
Motion
Special effects
Pacing & rhythm
Conceptual story rhythm
- 1
The Problem Unveiled
Purpose. Immediately hook the viewer by showcasing the core problem: a slow Mac, and how Pulse instantly reveals the culprits.
Execution. Opening with the Pulse app's 'Overview' and 'Apps & activity' sections, highlighting high CPU/Memory usage by common applications with quick, precise cursor movements.
- 2
Comprehensive Diagnostics
Purpose. Demonstrate Pulse's depth, showing it's not just about CPU/Memory but a full system diagnostic tool.
Execution. Rapid navigation through 'Disk', 'Network', 'Storage', 'Graphics', 'Projects', 'History', and 'Alerts' sections, each revealing detailed, live data graphs and lists.
- 3
The Digital Underbelly
Purpose. Transition from literal UI to an abstract representation of the Mac's internal processes, emphasizing Pulse's ability to 'see' what's happening.
Execution. Abstract motion graphics featuring glowing lines, particles, and geometric shapes, simulating data flow and system activity, with dynamic camera movements through this digital landscape.
- 4
Empowering Control
Purpose. Conclude by reinforcing the benefit: Pulse gives users understanding and control over their Mac's performance.
Execution. A return to a stylized Pulse logo or app representation, framed within the abstract data environment, culminating in a powerful visual statement.
Remix in Animatiq Studio
Master remix prompt · agent-ready
Sample remix
Objective
Launch video for 'Chronos', a project management SaaS.How the recipe adapts
Remix blueprint · pulse-inspired-data-flow-launch
Scene durations (5 scenes, 79.2s)
Key Remotion components
Related Productivity Product Launches
Explore all Productivity launches →
Don't type, just speak. Flawless voice-to-text across every app at 240 WPM.
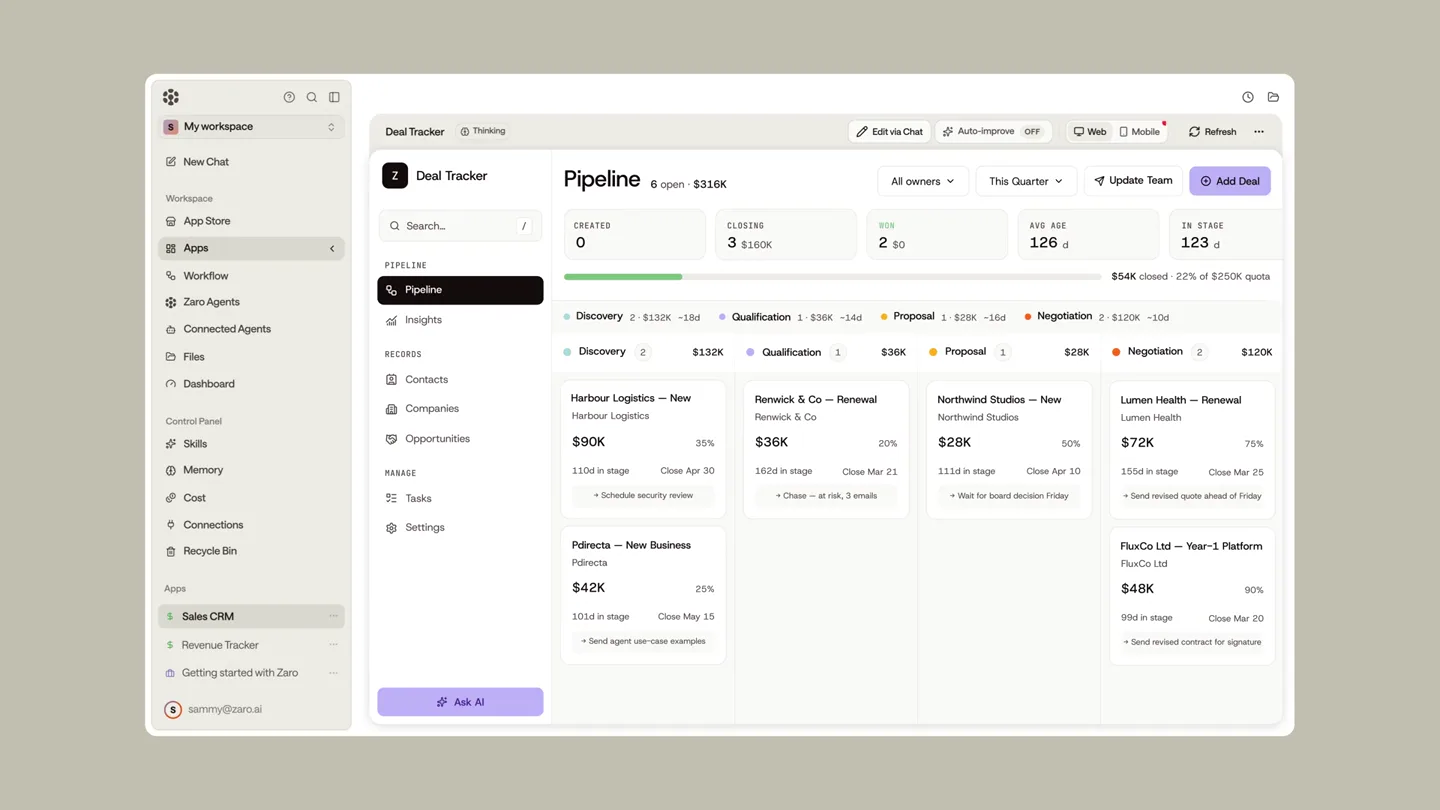
One workspace for knowledge scattered across Slack, email, Docs, and Notion. Connect your tools and build apps and agents that stay live with your data.
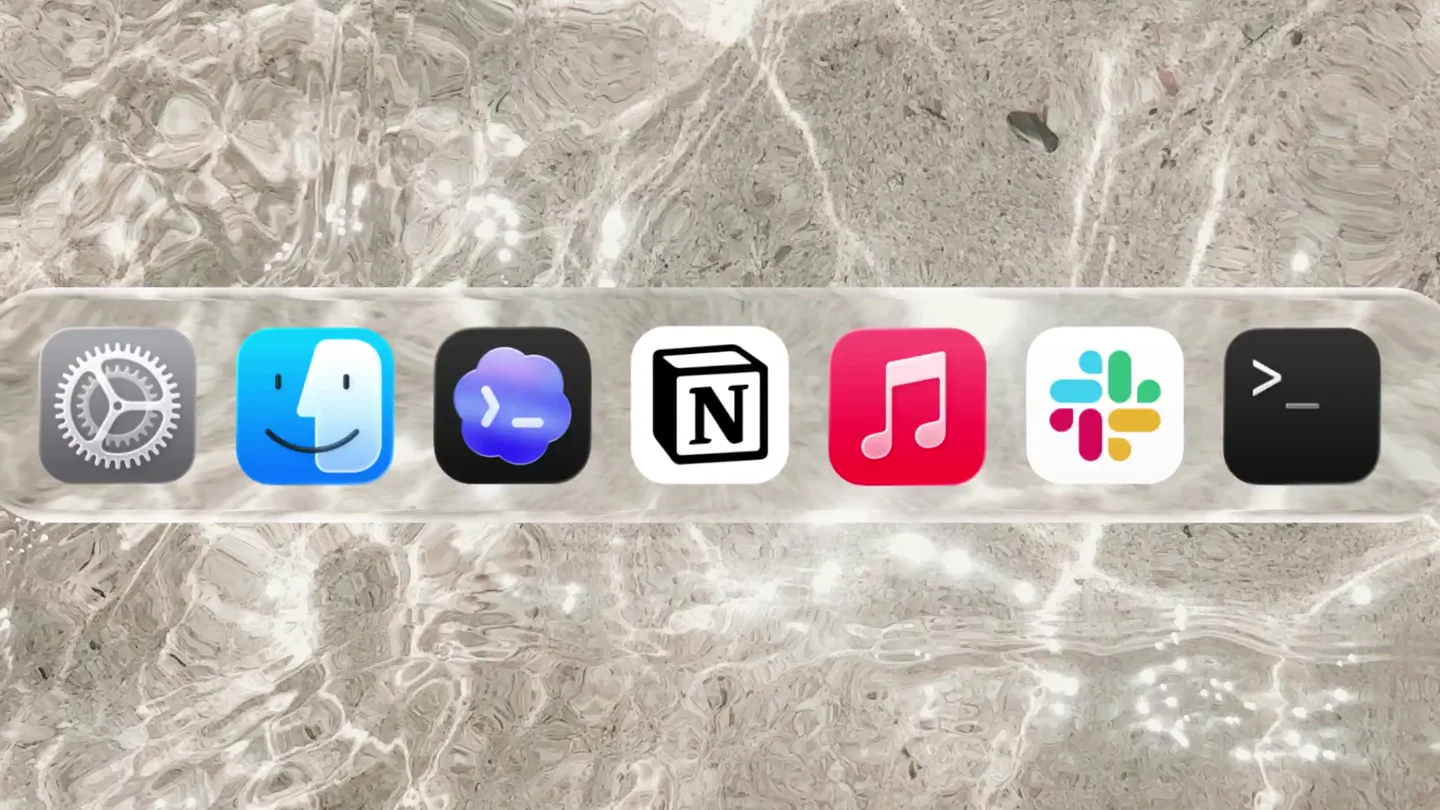
Notion positions itself as the backbone of your dock — a brand film of the Notion icon among everyday apps, ending on “Works with everything.”