
TrendSpider · Launch Video Breakdown: Hook, Pacing & Motion Design
$5,000 → $100,000,000 That's what Richard Dennis pulled off with his legendary trading system. "Ride breakouts. Cut losers fast. Let winners run." The Turtle Trading Strategy: now live and fully ba…
Scene-by-scene timeline & spoken transcript
The Hook
Dynamic Chart Data Visualization
“(No spoken dialogue — The track opens with a sustained, ethereal synth pad and a subtle, high-frequency riser. A pizzicato synth melody enters at 0:01, accompanied by a deep sub-bass pulse and a gentle, driving beat.)”
- On screen
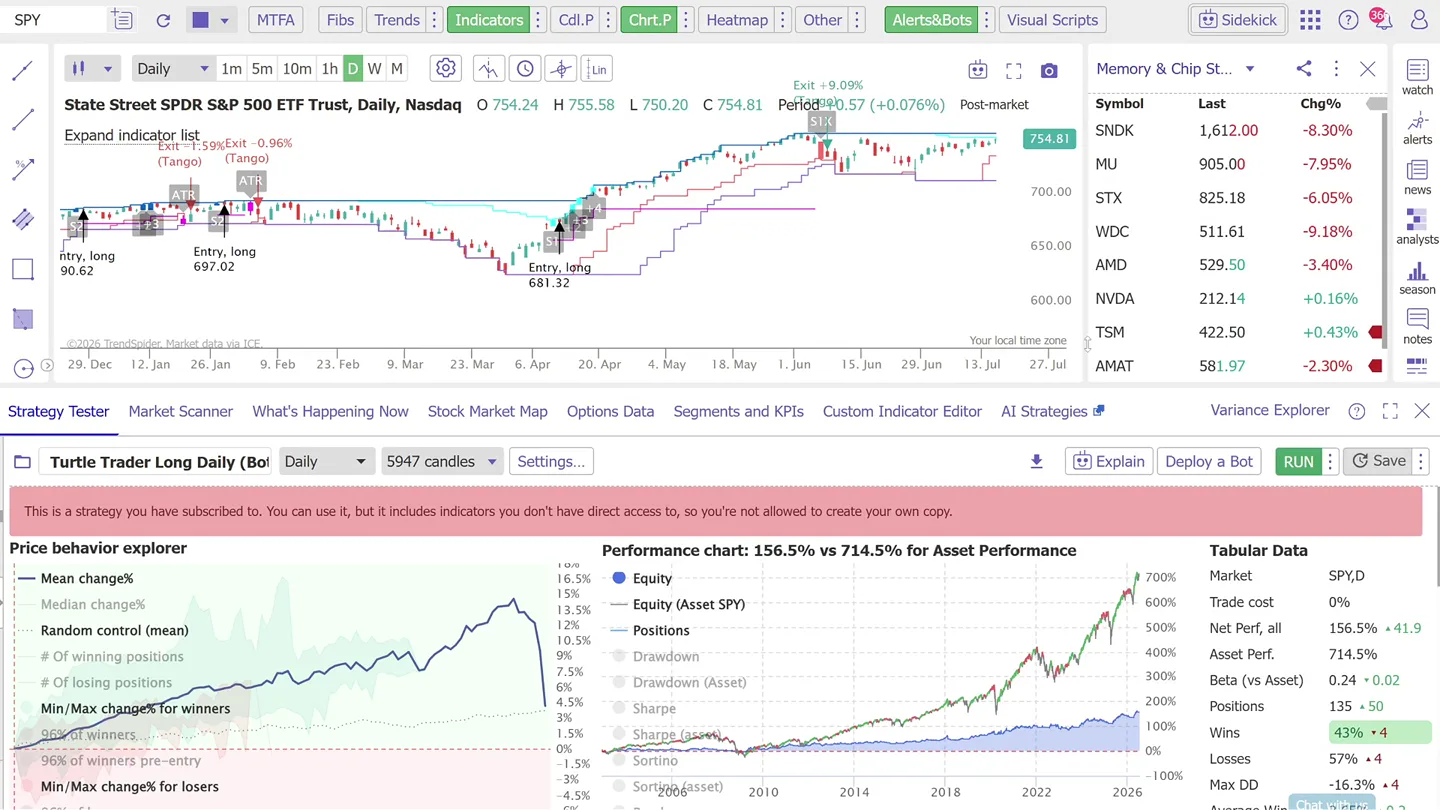
- SPY, C, MTFA, Fibs, Trends, Indicators, Cdl.P, Chrt.P, Heatmap, Other, Alerts&Bots, Visual Scripts, Sidekick, Daily, 1m 5m 10m 1h D W M, Ln, State Street SPDR S&P 500 ETF Trust, Daily, Nasdaq, O 754.24 H 755.58 L 750.20 C 754.81 Perfo, 740.57 (+0, Exit -9.09%, Expand indicator list, Entry, long, 697.02, Htry, long, 90.62, ATR, Entry, long, 681.32, ©2023 TrendSpider. Market data via ICE., 29. Dec, 12. Jan, 26. Jan, 9. Feb, 23. Feb, 9. Mar, 23. Mar, 6. Apr, 20. Apr, 4. May, 18. May, 1. Jun, 15. Jun, Strategy Tester, Market Scanner, What's Happening Now, Stock Market Map, Options Data, Segments and KPIs, Custom In, Turtle Trader Long Daily (Bo, Daily, 5947 candles, Settings..., This is a strategy you have subscribed to. You can use it, but it includes indicators you don't have direct access to, so you're not allowed to create your own copy., Price behavior explorer, Performance chart: 156.5% vs 714.59, Mean change%, Median change%, Random control (mean), # Of winning positions, # Of losing positions, Min/Max changes for winners, 96% of winners pre-entry, Min/Max changes for losers, Equity, Equity (Asset SPY), Positions, Drawdown, Sharpe, Sortino (Asset), 2006, 2008, 2010, 2012, 2014, 2016, 2018, 2020, 2022, 2026, Tabular Data, Market, SPY,D, Trade cost, 0%, Net Perf, all, 156.5% +41.9, Asset Perf., 714.5%, Beta (vs Asset), 0.24 +0.02, Positions, 135 +50, Wins, 43% +4, Losses, 57% +4, Max DD, -16.3% +4, CHOOSE A LIST OR A SCANNER, me, all, yours, system, index, sector, industry, holdings, scanner, subscr, crypto, Memory & Chip St..., Symbol, Chg%, watch, SNDK, 1,612.00, -8.30%, MU, 905.00, -7.95%, STX, 825.18, -6.05%, WDC, 511.61, -9.18%, AMD, 529.50, -3.40%, NVDA, 212.14, +0.16%, TSM, 422.50, +0.43%, AMAT, 581.97, -2.30%, Your local time zone, Jul 21, 2026 (Jul 15, 2026 + 4 candles)., alerts, news, analysts, season, notes, Custom Indicator Editor, AI Strategies, Variance Explorer, Explain, Deploy a Bot, RUN, Save, Performance chart: 156.5% vs 714.5% for Asset Performance, Tabular Data, Market, SPY,D, Trade cost, 0%, Net Perf, all, 156.5% +41.9, Asset Perf., 714.5%, Beta (vs Asset), 0.24 +0.02, Positions, 135 +50, Wins, 43% +4, Losses, 57% +4, Max DD, -16.3% +4, Chat with us
- Camera
- The camera slowly zooms into a complex trading chart interface, highlighting specific data points and indicators. The perspective is a direct, slightly elevated view of the software.
- Motion
- Subtle camera zoom and pan, data point highlighting with animated overlays, and dynamic chart line drawing. UI elements animate into focus.
Product Reveal
Accelerated Data Simulation
“(No spoken dialogue — A notable high-energy transition occurs at 0:11 with a subtle sweep and a slight increase in intensity. The instrumentation builds with additional synth layers and a more prominent, arpeggiated synth line.)”
- On screen
- STX, Seagate Technology Holdings PLC, Daily, Nasdaq, O 889.02 H 893.00 L 789.93 C 828.30 Period -60.72 (-6.80%) Post-market, Exit -8.31% (Tango), Entry, long, 464.76, Exit -11.93% (Tango), Entry, long, 419.40, Exit -3.33% (Tango), ATR, Entry, long, 322.98, (TRIGGERED) Trusting Williams, Entry, long, 546.89, Exit -5.49% (Tango), Exit -0.62% (Tango), Performance chart: 12853.1% vs 9654.7% for Asset Performance, Tabular Data, Market, AMD,D, Trade cost, 0%, Net Perf, all, 12853.1% +..., Asset Perf., 9654.7%, Beta (vs Asset), 0.36 +0.04, Positions, 119 +13, Wins, 48% +6, Losses, 52% +6, Max DD, -47.8% +0.8, Chat with us
- Camera
- The camera maintains a similar perspective but the focus shifts to different stock symbols and their corresponding performance charts. Rapid data updates and chart movements are emphasized.
- Motion
- Fast-paced data updates, rapid chart line animations, and quick transitions between different stock performance views. Numerical values animate quickly.
Call to Action
Brand Reveal and Call to Action
“(No spoken dialogue — Another sweep and a more pronounced sub-bass drop/impact are heard at 0:23, leading into a slightly more energetic phase with layered synths and a sustained, shimmering texture. The track maintains a consistent, atmospheric feel throughout, with a focus on evolving synth textures and rhythmic pulses.)”
- On screen
- TrendSpider®
- Camera
- The camera smoothly transitions from the detailed UI to a full-screen display of the TrendSpider logo against a dark, subtly animated background.
- Motion
- Seamless fade-out from UI, subtle background animation with glowing particles, and a clean, centered logo reveal with a slight glow effect.
Motion design primitives
Synthesizable in Remotion · key components of the dynamic-data-dashboard-reveal template.
DynamicChartLineDraw
Animated lines and areas on a chart dynamically draw themselves, simulating real-time data plotting. Numerical values associated with these lines update rapidly.
+ Code construction recipe
Utilize SVG path animations with `stroke-dasharray` and `stroke-dashoffset` for line drawing. For area fills, animate `d` attribute of SVG paths. Use `interpolate` for smooth numerical transitions.
UIElementHighlightFocus
Specific UI elements, such as stock symbols or indicator buttons, are highlighted with a subtle glow or color change, drawing the viewer's attention to key interactive areas.
+ Code construction recipe
Implement CSS `box-shadow` or `filter: drop-shadow()` for glow effects. Animate `background-color` or `color` properties using `spring` for a soft, responsive highlight.
DataOverlayPopIn
Small data labels and performance metrics appear and disappear over the chart, often with a quick scale-up or fade-in animation, indicating specific events or values.
+ Code construction recipe
Use `scale` and `opacity` animations with `interpolate` for pop-in/fade-in effects. Coordinate timing with chart events. Consider a slight `translateY` for a subtle lift.
Style DNA & aesthetic system
Visual aesthetic
Typography
Motion
Special effects
Pacing & rhythm
Conceptual story rhythm
- 1
Initial Data Immersion
Purpose. To immediately showcase the product's core functionality and data visualization capabilities, establishing its technical prowess.
Execution. Slow zoom into a complex trading chart, highlighting entry/exit points and performance metrics with animated overlays.
- 2
Accelerated Performance Demonstration
Purpose. To demonstrate the speed and efficiency of the platform in processing and displaying complex trading strategies across different assets.
Execution. Rapid cycling through various stock charts, showing quick updates of performance percentages and strategy outcomes.
- 3
Brand Affirmation
Purpose. To connect the powerful data visualization directly to the TrendSpider brand, reinforcing its identity.
Execution. A smooth transition from the detailed UI to a clean, full-screen display of the TrendSpider logo.
- 4
Concluding Statement
Purpose. To leave a lasting impression of the brand's sophistication and technological edge.
Execution. The TrendSpider logo remains on screen with a subtle, ambient background, allowing the viewer to absorb the brand.
Remix in Animatiq Studio
Master remix prompt · agent-ready
Sample remix
Objective
Launch an AI-powered cybersecurity platform called 'SentinelGuard' that detects real-time threats.How the recipe adapts
The DynamicChartLineDraw primitive will be adapted to visualize real-time threat vectors and network traffic anomalies. UIElementHighlightFocus will highlight critical security alerts and compromised nodes on a network map. DataOverlayPopIn will display rapidly updating threat scores and incident counts. The color palette will shift to dark blues and greens, maintaining the high-tech, data-driven aesthetic. The camera will navigate through abstract network graphs instead of stock charts, showcasing the AI's detection capabilities.Remix blueprint · dynamic-data-dashboard-reveal
Scene durations (3 scenes, 32.5s)
Key Remotion components
Related Tech & SaaS Product Launches
Explore all Tech & SaaS launches →
Unreal Engine 6 has been announced with Rocket League.
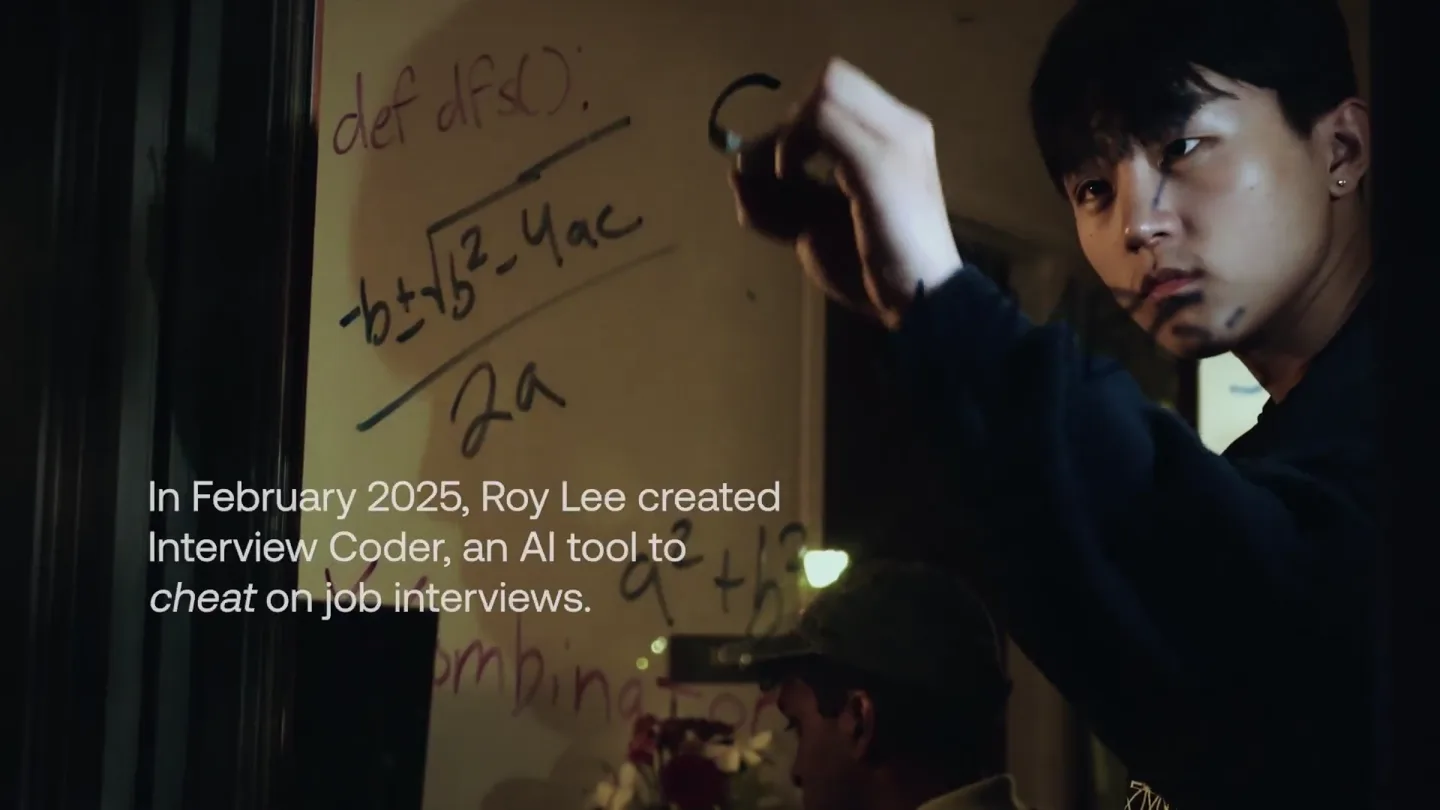
announcing @cluely's $15M fundraise, led by @a16z. cheat on everything.
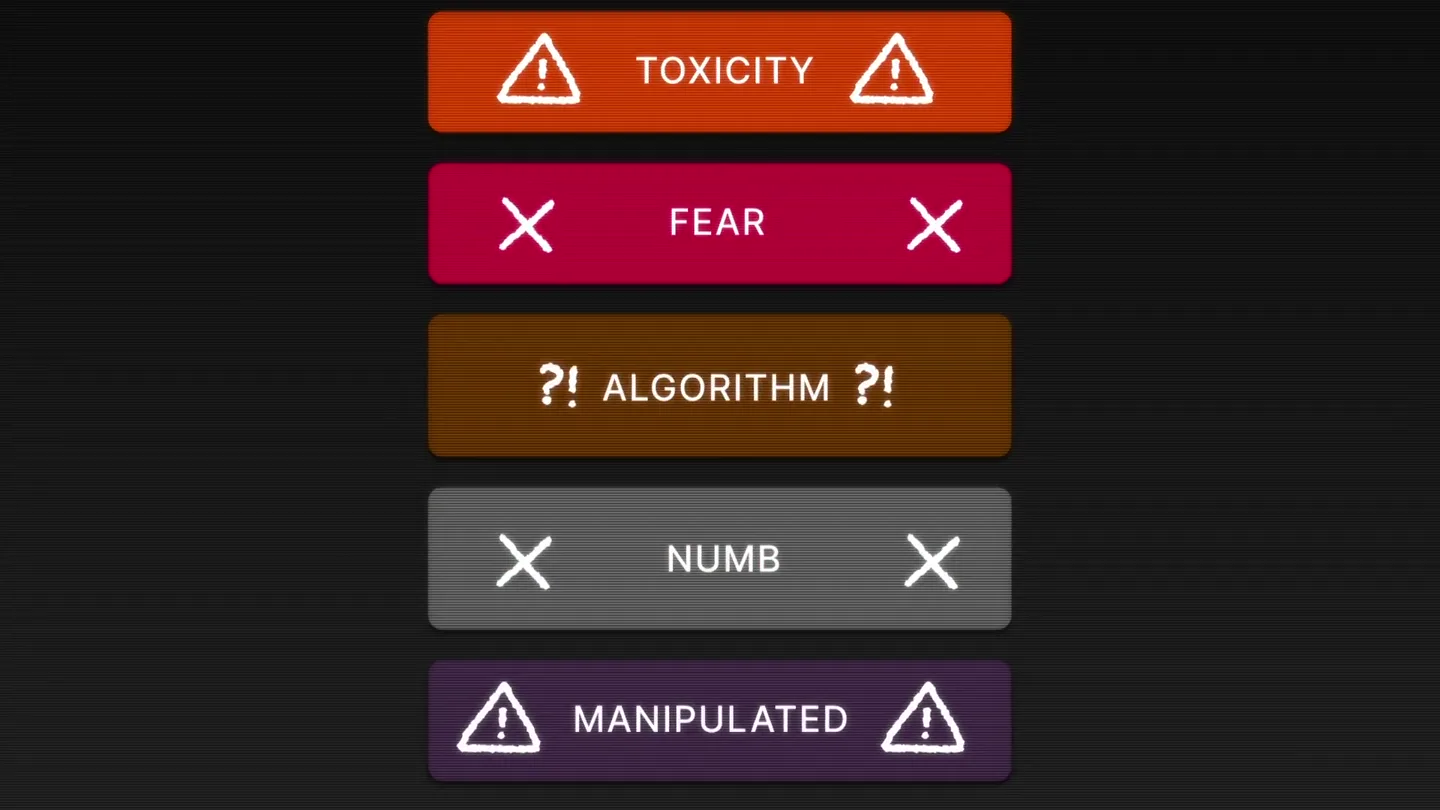
Yesterday we launched Bouncer to put users in control of their Twitter feed. Today, we open sourced the Chrome extension. We believe software should align with your interests, not the company that…