
eric zakariasson · Launch Video Breakdown: Hook, Pacing & Motion Design
introducing cursor profiles! go claim your handle at https://authenticator.cursor.sh/...
Scene-by-scene timeline & spoken transcript
The Hook
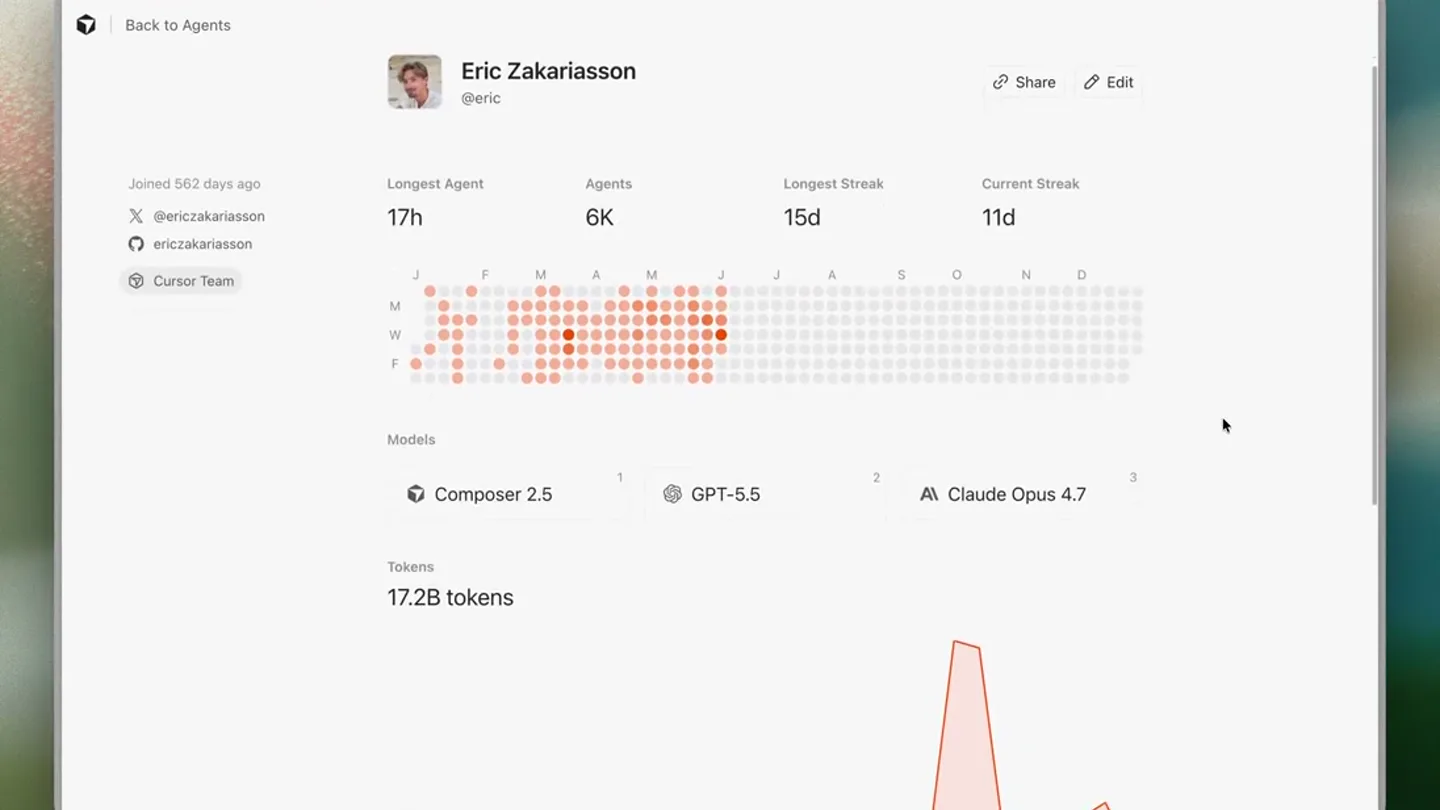
User Profile Overview
“(No spoken dialogue — silent video with ambient visual focus.)”
- On screen
- Eric Zakariasson @eric Joined 562 days ago @ericzakariasson ericzakariasson Cursor Team Longest Agent 17h Agents 6K Longest Streak 15d Current Streak 11d Models Composer 2.5 GPT-5.5 Claude Opus Tokens 17.2B tokens
- Camera
- Static, wide shot of a desktop application window, showing a user profile dashboard.
- Motion
- Subtle cursor hover and click interaction, revealing tooltips and highlighting data points.
Product Reveal
Token Usage & Agent Activity
“(No spoken dialogue — silent video with ambient visual focus.)”
- On screen
- Back to Agents Eric Zakariasson @eric Share Edit Joined 562 days ago @ericzakariasson ericzakariasson Cursor Team Longest Agent 17h Agents 6K Longest Streak 15d Current Streak 11d Models Composer 2.5 GPT-5.5 Claude Opus 4.7 Tokens 17.2B tokens May 6 Today Agents 6K agents Local (5.5K) Cloud (500)
- Camera
- Static, wide shot of the application window. The view scrolls down to reveal more data.
- Motion
- Smooth vertical scroll animation, revealing new sections of the dashboard with line and bar charts.
Feature Teaser
Detailed Token & Agent Metrics
“(No spoken dialogue — silent video with ambient visual focus.)”
- On screen
- Tokens 17.2B tokens 278.7M tokens May 12 May 6 Today Agents 6K agents Local (5.5K) Cloud (500) 436.9M tokens May 22 405.3M tokens May 26
- Camera
- Static, zoomed-in view on the charts, with the cursor interacting.
- Motion
- Cursor hover animations over data points on the line chart, triggering dynamic tooltips with specific token counts and dates.
Call to Action
Agent Distribution Breakdown
“(No spoken dialogue — silent video with ambient visual focus.)”
- On screen
- Back to Agents Tokens 17.2B tokens May 6 Today Agents 6K agents Local (5.5K) Cloud (500) Local: 127 Cloud: 6 Jun 3 Local: 38 Cloud: 51 May 22
- Camera
- Static, zoomed-in view on the bar chart, with cursor interaction.
- Motion
- Cursor hover animations over bar chart segments, revealing tooltips detailing 'Local' and 'Cloud' agent counts for specific dates.
Motion design primitives
Synthesizable in Remotion · key components of the clean-ui-data-dashboard template.
DashboardScrollReveal
A smooth vertical scroll effect that reveals new sections of a dashboard or application interface, maintaining a consistent window frame.
+ Code construction recipe
Implement using `scrollPosition` and `interpolate` to animate the `translateY` property of the content container. Use a `spring` for a natural, slightly elastic scroll feel.
InteractiveChartTooltip
On-hover, a small, informative tooltip appears next to a data point on a chart (line or bar), displaying specific metrics and dates.
+ Code construction recipe
Utilize `useCurrentFrame` and `interpolate` for opacity and scale animations on tooltip elements. Position tooltips dynamically based on cursor coordinates or data point positions. Use `spring` for the tooltip's entrance and exit animation.
DataPointHighlight
Individual data points on charts (e.g., dots on a line chart, segments of a bar chart) subtly highlight or change color upon cursor interaction.
+ Code construction recipe
Apply `useCurrentFrame` and `interpolate` to animate `backgroundColor` or `scale` properties of SVG shapes or div elements representing data points. Ensure smooth transitions using `spring` or `ease-in-out` curves.
Style DNA & aesthetic system
Visual aesthetic
Typography
Motion
Special effects
Pacing & rhythm
Conceptual story rhythm
- 1
Profile Overview
Purpose. Introduce the user's identity and high-level activity metrics within the platform.
Execution. Static shot of a user profile dashboard, showing name, handle, and summary stats like 'Longest Agent' and 'Agents'.
- 2
Initial Data Exploration
Purpose. Transition to more detailed performance metrics, specifically token usage and agent activity over time.
Execution. Smooth vertical scroll revealing line and bar charts for 'Tokens' and 'Agents', maintaining the application window context.
- 3
Interactive Data Deep Dive
Purpose. Demonstrate the granularity of data available by interacting with specific points on the charts.
Execution. Cursor hovers over line chart data points, triggering tooltips with precise token counts and dates.
- 4
Agent Distribution Insight
Purpose. Show the breakdown of agent types (Local vs. Cloud) and their activity over time.
Execution. Cursor hovers over bar chart segments, revealing tooltips with 'Local' and 'Cloud' agent counts for specific dates.
Remix in Animatiq Studio
Master remix prompt · agent-ready
Sample remix
Objective
Showcasing a real-time data pipeline monitoring dashboard for 'QuantumFlow'.How the recipe adapts
The DashboardScrollReveal primitive would be used to transition between different sections of the QuantumFlow dashboard, such as pipeline overview and detailed job logs. InteractiveChartTooltip would highlight throughput rates or error counts on a real-time graph. DataPointHighlight would visually emphasize active or problematic nodes within a workflow visualization, changing color upon hover to reveal specific status details.Remix blueprint · clean-ui-data-dashboard
Scene durations (4 scenes, 9.8s)
Key Remotion components
Related Developer Tools Product Launches
Explore all Developer Tools launches →
xAI opens voice cloning on its API: build a custom voice in about two minutes or pick from 80+ voices in 28 languages.

Claude can now operate your Mac, opening apps, browsing and filling spreadsheets, as a research preview in Cowork and Claude Code.

Agentic CLI for coding, building apps, and automating workflows.