
Benji Taylor · Launch Video Breakdown: Hook, Pacing & Motion Design
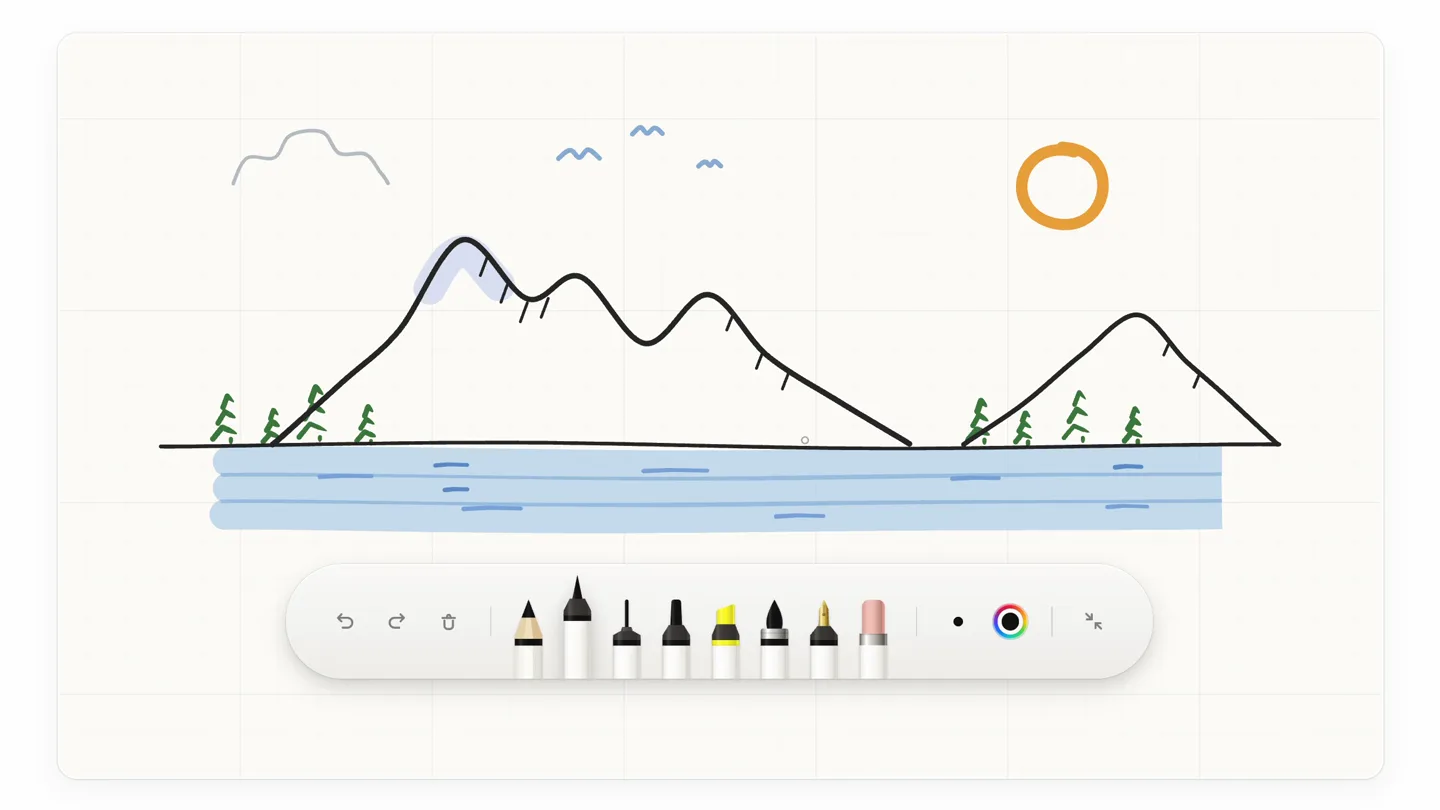
The easiest way to add drawing tools to any React app: a simple, delightful toolbar with smooth animations. Fully open source, zero dependencies.
Scene-by-scene timeline & spoken transcript
The Hook
Intuitive Tool Selection & Hover States
“(No spoken dialogue — ambient visual with subtle UI sounds implied by cursor movement)”
- On screen
- Pencil C Brush B
- Camera
- Static, full-frame view of a digital canvas with a drawing toolbar at the bottom.
- Motion
- Smooth cursor hover animations, tool selection highlight, and tooltip pop-ups.
Feature Teaser
Dynamic Color Palette Interaction
“(No spoken dialogue — ambient visual with subtle UI sounds implied by cursor movement)”
- On screen
- (No on-screen text)
- Camera
- Static, full-frame view of a digital canvas with a drawing toolbar at the bottom.
- Motion
- Toolbar expansion with a horizontal color picker, smooth color selection animation with a checkmark.
Feature Teaser
Precision Control: Size & Opacity Sliders
“(No spoken dialogue — ambient visual with subtle UI sounds implied by cursor movement)”
- On screen
- Size 6 Opacity 100% Size 13 Opacity 100% Size 5 Opacity 100%
- Camera
- Static, full-frame view of a digital canvas with a drawing toolbar at the bottom.
- Motion
- Toolbar expansion with horizontal sliders for size and opacity, smooth slider interaction and value updates.
Product Reveal
Effortless Erasing and Undo/Redo
“(No spoken dialogue — ambient visual with subtle UI sounds implied by cursor movement)”
- On screen
- Clear all Pen P Fineliner F Brush B
- Camera
- Static, full-frame view of a digital canvas with a drawing toolbar at the bottom.
- Motion
- Smooth undo/redo animations, eraser tool selection, and clear all functionality with visual feedback.
Call to Action
Highlighting and Clearing the Canvas
“(No spoken dialogue — ambient visual with subtle UI sounds implied by cursor movement)”
- On screen
- Clear all
- Camera
- Static, full-frame view of a digital canvas with a drawing toolbar at the bottom.
- Motion
- Drawing with a highlighter, undoing the highlight, and finally clearing the entire canvas with a quick fade.
Motion design primitives
Synthesizable in Remotion · key components of the interactive-dev-tool-showcase template.
ToolbarExpansion
The drawing toolbar smoothly expands or contracts to reveal additional options like color palettes or sliders. This expansion is often accompanied by a subtle bounce or spring effect.
+ Code construction recipe
Utilize Remotion's `spring()` function for the `height` or `width` property of the toolbar container. Animate `opacity` and `transform` (e.g., `translateY`) for the appearing/disappearing elements within the expanded section, using `interpolate()` with an easing function like `EASE_OUT_CUBIC`.
ToolHoverHighlight
When the cursor hovers over a tool icon, a subtle background highlight appears, and a tooltip with the tool's name and shortcut key slides up from the icon.
+ Code construction recipe
Implement `useCurrentFrame()` and `interpolate()` to animate the `backgroundColor` or `boxShadow` of the tool icon on hover. For the tooltip, animate its `opacity` and `transform` (e.g., `translateY`) using `spring()` or `interpolate()` with a short duration and `EASE_OUT_QUAD`.
SliderValueUpdate
As a slider is dragged, its corresponding numerical value updates in real-time, and the slider's fill visually extends or retracts smoothly.
+ Code construction recipe
Bind the slider's fill `width` and the displayed numerical `text` content to a state variable. Use `interpolate()` to smoothly transition the `width` of the fill element. For the numerical value, ensure it updates instantly or with a very subtle, fast `spring()` effect on its `opacity` or `scale` for a 'pop' if desired.
Style DNA & aesthetic system
Visual aesthetic
Typography
Motion
Special effects
Pacing & rhythm
Conceptual story rhythm
- 1
Feature Introduction
Purpose. Introduce a core drawing tool or UI element.
Execution. Cursor hovers over a tool, tooltip appears, tool is selected with a subtle highlight.
- 2
Interaction Demonstration
Purpose. Showcase the functionality of the selected tool or UI control.
Execution. Toolbar expands, sliders are dragged, colors are picked, or drawing actions are performed on the canvas.
- 3
Result & Feedback
Purpose. Illustrate the immediate visual outcome of the interaction.
Execution. Drawing appears, color changes, line thickness adjusts, or elements are erased/cleared.
- 4
Seamless Transition
Purpose. Move to the next feature or reset the canvas for a new demonstration.
Execution. Toolbar retracts, canvas is cleared, or a new tool is selected, maintaining a fluid user experience.
Remix in Animatiq Studio
Master remix prompt · agent-ready
Sample remix
Objective
Demonstrate a new React component library for building interactive data dashboards.How the recipe adapts
The recipe adapts by showcasing the dashboard builder's UI. Instead of drawing tools, the toolbar would feature chart types (bar, line, pie). Hovering over a chart icon would reveal its name. Selecting a chart would expand the toolbar to show data source selectors and customization sliders for axes, colors, and data ranges. As sliders are adjusted, the chart on the main canvas would update in real-time with smooth transitions. The 'clear all' function would reset the dashboard layout.Remix blueprint · interactive-dev-tool-showcase
Scene durations (4 scenes, 27s)
Key Remotion components
Related Developer Tools Product Launches
Explore all Developer Tools launches →
xAI opens voice cloning on its API: build a custom voice in about two minutes or pick from 80+ voices in 28 languages.
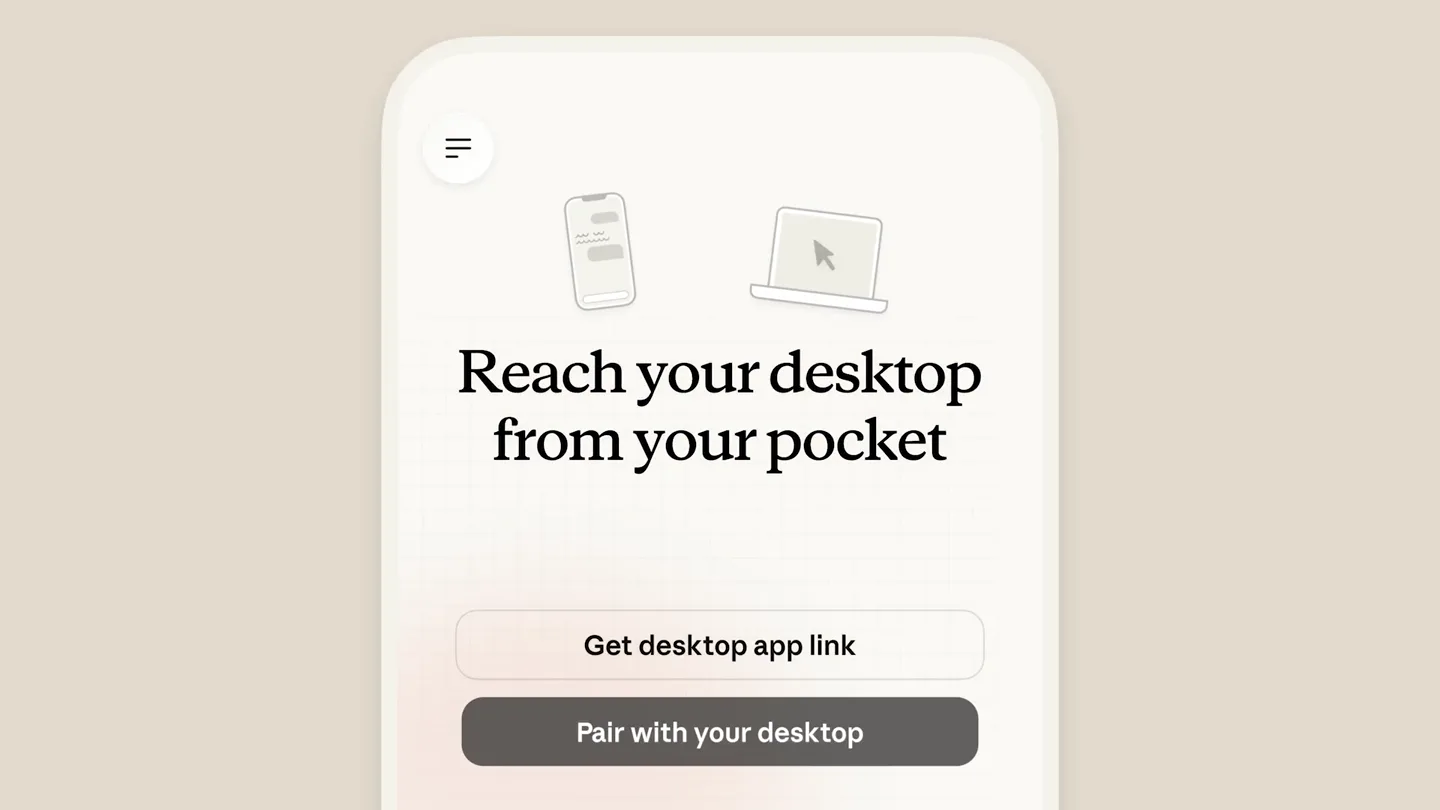
Claude can now operate your Mac, opening apps, browsing and filling spreadsheets, as a research preview in Cowork and Claude Code.

Agentic CLI for coding, building apps, and automating workflows.