
EvilCharts · Launch Video Breakdown: Hook, Pacing & Motion Design
ECharts rendering engine in EvilCharts for high-performance dashboards. 8 charts, 108 examples, 18 custom blocks. Free and open source for Next.js/React.
Scene-by-scene timeline & spoken transcript
The Hook
Dynamic Chart Introduction
“(No spoken dialogue — Ambient visual with a subtle, rhythmic beat at 110 BPM.)”
- On screen
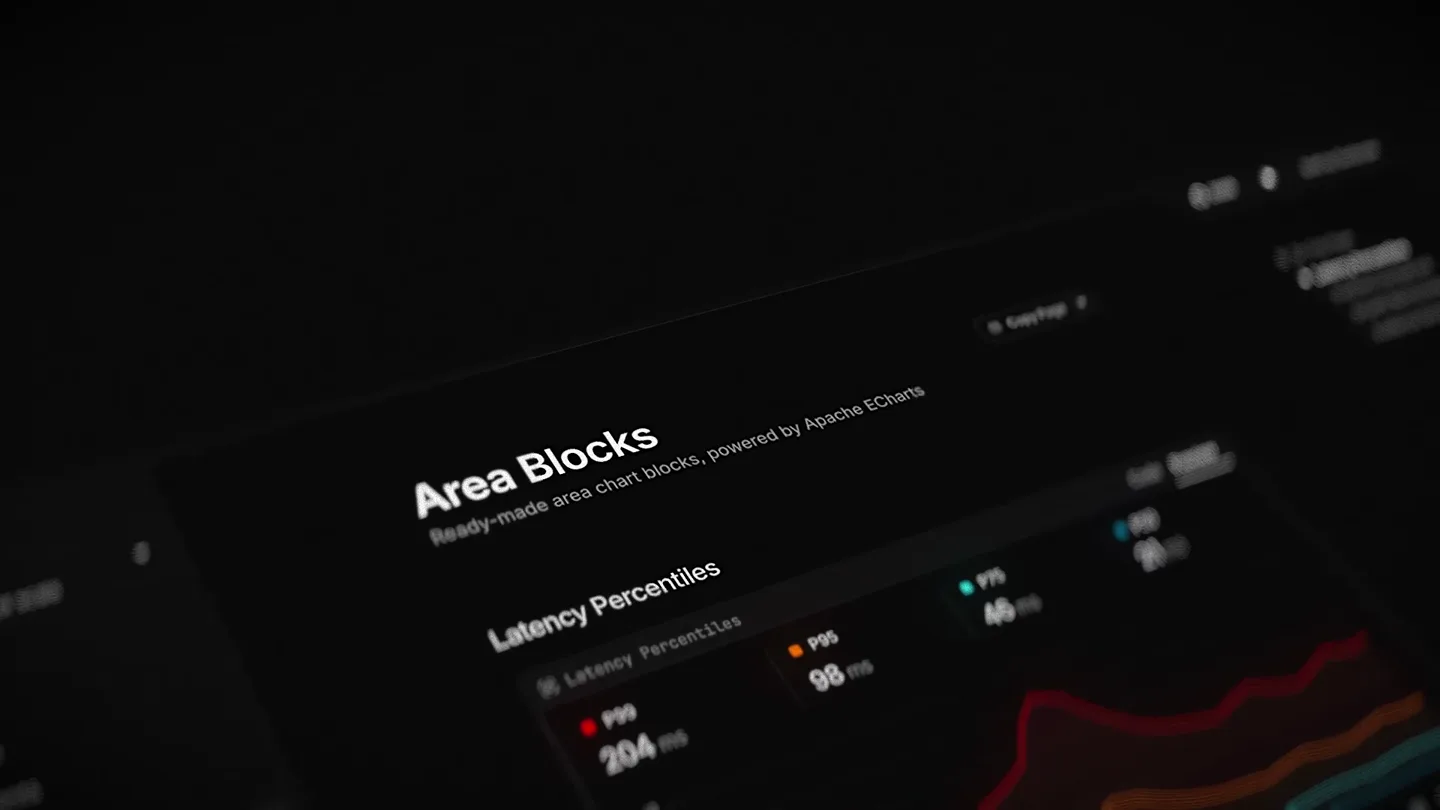
- Area Blocks Ready-made area chart blocks, powered by Apache ECharts Latency Percentiles P99 204 ms P95 98 ms P75 46 ms
- Camera
- Slow, smooth pan across a dashboard displaying an area chart, revealing key metrics.
- Motion
- Subtle camera pan, text reveal with a slight blur/focus shift, and data points animating into view.
Product Reveal
Engine Selection & Chart Variety
“(No spoken dialogue — Ambient visual with a subtle, rhythmic beat at 110 BPM.)”
- On screen
- EVIL CHARTS ECharts Canvas · built for scale Rendering engine ECharts SOON Canvas · built for scale Recharts SVG · the original Evil charts Components Area Chart Default Area Blocks Line Chart Bar Chart Composed Chart Radar Chart Pie Chart Radial Chart Sankey Chart Chart Components Tooltip Legend Latency Percentiles P99 204 ms P95 98 ms P75 46 ms
- Camera
- Camera zooms out slightly and pans to the left, highlighting a sidebar menu for rendering engine selection and chart types.
- Motion
- Zoom out and pan, menu item highlight animation, and subtle data updates on the chart.
Feature Teaser
Performance & Customization
“(No spoken dialogue — Ambient visual with a subtle, rhythmic beat at 110 BPM.)”
- On screen
- Area Blocks Ready-made area chart blocks, powered by Apache ECharts Best week 445 signups in W08 Code Preview Organic Paid
- Camera
- Quick pan and zoom to a bar chart, focusing on specific data points and their glow effects.
- Motion
- Rapid camera movement, glowing bar chart elements, and numerical data count-up animation.
Call to Action
Installation & Ecosystem
“(No spoken dialogue — Ambient visual with a subtle, rhythmic beat at 110 BPM.)”
- On screen
- Total booked $121,000 4 sources · 4 routes Retail $31,488 Services $28,348 Licensing $14,960 npm yarn bun pnpm npx shadcn@Latest add @evilcharts/ui/chart
- Camera
- Final pan across a dashboard showing financial data and developer installation commands.
- Motion
- Smooth horizontal pan, text reveal for installation commands, and subtle glow on data elements.
Motion design primitives
Synthesizable in Remotion · key components of the dark-mode-dev-dashboard-reveal template.
DashboardPanReveal
A smooth, slow camera pan across a dark-themed dashboard, revealing different chart types and data points sequentially. Text elements appear with a subtle fade-in and slight scale.
+ Code construction recipe
Use `interpolate` for camera position (x, y, z) and rotation (pitch, yaw). Apply `spring` for text opacity and scale transitions. Implement a `Sequence` component to orchestrate the timing of text and chart element reveals.
GlowingDataHighlight
Specific data points or chart bars glow with a vibrant, soft light, drawing attention to key metrics. The glow intensifies and then subtly fades.
+ Code construction recipe
Utilize SVG filters for `feGaussianBlur` and `feColorMatrix` to create the glow effect. Animate the `stdDeviation` of the blur and the `opacity` of the glow color using `spring` or `interpolate` with an ease-in-out curve. Apply this to individual chart elements.
DynamicMenuInteraction
A sidebar menu expands or highlights items with a smooth transition, revealing nested options or selections. The selected item often has a distinct background or icon change.
+ Code construction recipe
Animate the `width` or `transform` (translateX) of the sidebar using `spring`. For menu items, animate `backgroundColor` and `opacity` on hover/selection. Use `Sequence` to stagger the appearance of nested menu items.
Style DNA & aesthetic system
Visual aesthetic
Typography
Motion
Special effects
Pacing & rhythm
Conceptual story rhythm
- 1
Initial Immersion
Purpose. Immediately draw the viewer into the product's interface, showcasing its core functionality and visual appeal.
Execution. Slow pan over a dynamic area chart, highlighting key performance metrics with glowing data.
- 2
Feature Exploration
Purpose. Demonstrate the breadth of the product's capabilities, such as different rendering engines and chart types.
Execution. Camera shifts to reveal a navigation sidebar, showing various chart components and engine options.
- 3
Impact & Performance
Purpose. Emphasize the product's ability to visualize critical data and its high-performance nature.
Execution. Quick cuts and zooms to different charts (bar, financial), with glowing elements and numerical animations.
- 4
Developer Empowerment
Purpose. Conclude by showing how easy it is for developers to integrate and use the tool.
Execution. Final pan across a dashboard displaying installation commands and a summary of the product's ecosystem.
Remix in Animatiq Studio
Master remix prompt · agent-ready
Sample remix
Objective
Launch a new AI-powered code refactoring tool called 'SyntaxFlow'.How the recipe adapts
The SyntaxFlow video would open with a DashboardPanReveal across a code editor interface, showing real-time refactoring suggestions glowing with a vibrant blue. The DynamicMenuInteraction primitive would highlight different refactoring options in a sidebar. GlowingDataHighlight would be used to emphasize lines of code that have been optimized or identified for improvement. The final scene would pan over a terminal showing installation commands for SyntaxFlow, maintaining the dark theme and technical typography.Remix blueprint · dark-mode-dev-dashboard-reveal
Scene durations (4 scenes, 24s)
Key Remotion components
Related Developer Tools Product Launches
Explore all Developer Tools launches →
xAI opens voice cloning on its API: build a custom voice in about two minutes or pick from 80+ voices in 28 languages.

Claude can now operate your Mac, opening apps, browsing and filling spreadsheets, as a research preview in Cowork and Claude Code.

Agentic CLI for coding, building apps, and automating workflows.