
Yohei Nakajima · Launch Video Breakdown: Hook, Pacing & Motion Design
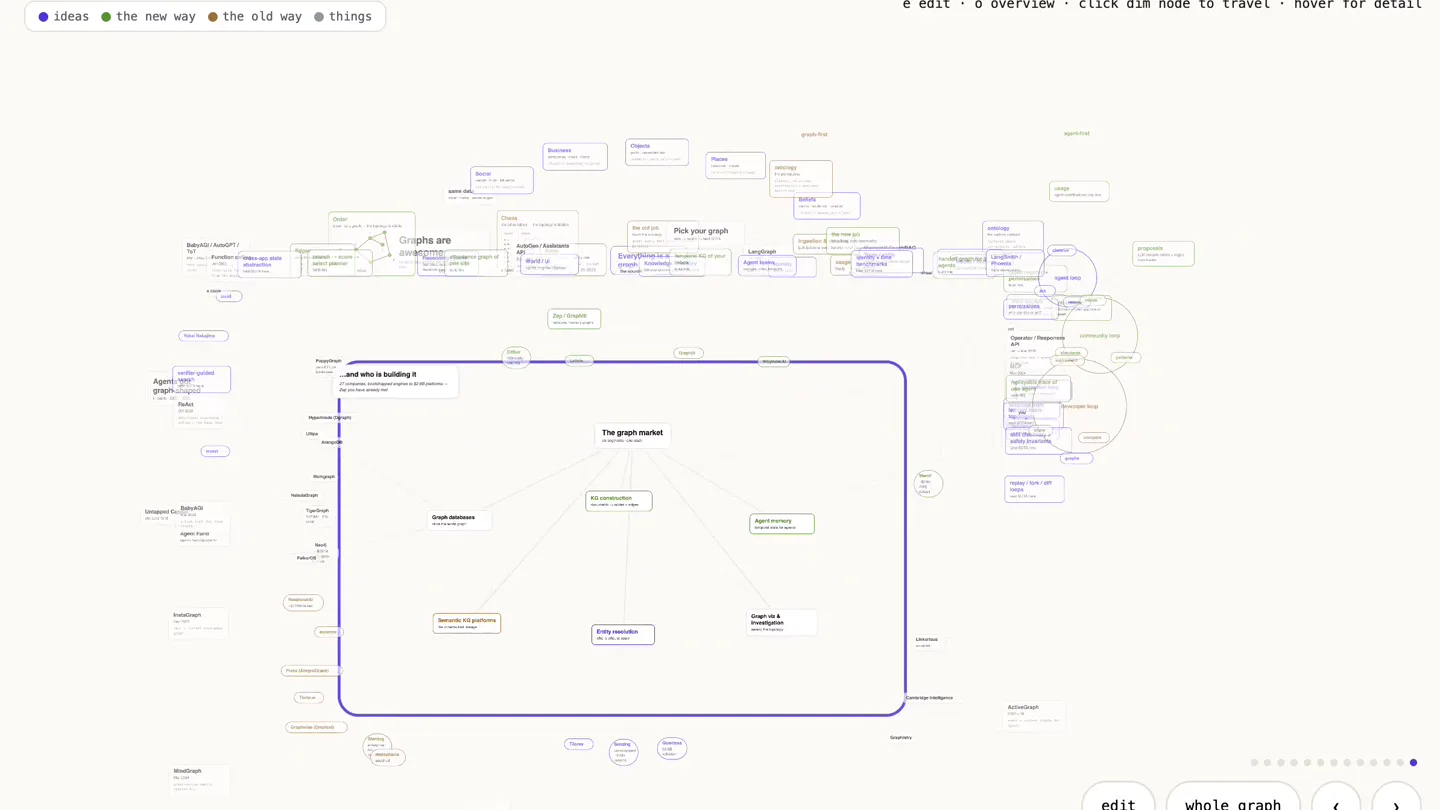
A graph-based slide system: nodes carry slide numbers, and selecting a slide pulls in the matching nodes. Demo and source on GitHub.
Scene-by-scene timeline & spoken transcript
The Hook
Graph-Based Slide System Introduction
“(No spoken dialogue — ambient visual presentation of a graph-based slide system.)”
- On screen
- Graphs are awesome GraphCon July 25, 2026 ideas the new way the old way things e edit o overview - navigate - drag pan - scroll zoom click dim node to travel - hover for detail 13 / 13 edit whole graph
- Camera
- Wide shot of a complex graph, then a rapid zoom-in to a specific node.
- Motion
- Rapid camera zoom, node highlighting, and dynamic content reveal.
Problem Agitation
The Power of Graphs and Order vs. Chaos
“(No spoken dialogue — visual demonstration of graph concepts.)”
- On screen
- Graphs are awesome GraphCon July 25, 2026 ideas the new way the old way things e edit o overview - navigate - drag pan - scroll zoom click dim node to travel - hover for detail Graphs are awesome because relationships are where the meaning lives :presented_by Yohei Nakajima GraphCon · Jul 25 2026 01 / 13 - 0/4 edit whole graph Invest :does Function calling Jun 2023 structured tool edges from the model build Order vs chaos the same seven nodes and seven edges — drawn, the structure is obvious; listed, it is invisible same data seven nodes - seven edges :drawn_as :stored_as Order drawn as a graph — the topology is visible Chaos stored as tables — the topology is hidden nodes edges a a-b b b-c c c-d d d-e e e-f f f-g g 02 / 13 edit whole graph Everything is a graph press next: ten real things, five domains, one interwoven graph Business people + orgs (founder_of, fund_of, fund_to, connected_to, class) Objects path, dependencies (owns, is_part_of, is_type_of, uses) Places locations, nodes (part_of, is_adjacent_to) Social people, trust, influence (follows, is_friend_of, is_class) Beliefs claims, evidence, revision (is_claim_of, based_on, is_false) Everything is a graph alice :follows bob :is_connected acme :a_fund 03 / 13 - 1/1 edit whole graph
- Camera
- Sequential panning and zooming to highlight different graph nodes and their connections, then a comparison view of 'Order vs Chaos'.
- Motion
- Node-based navigation, animated connections, and side-by-side comparison with dynamic text overlays.
Product Reveal
Exploring Graph Applications and the Agent Loop
“(No spoken dialogue — detailed exploration of graph applications.)”
- On screen
- Graphs are awesome GraphCon July 25, 2026 ideas the new way the old way things e edit o overview - navigate - drag pan - scroll zoom click dim node to travel - hover for detail Agents got graph-shaped the talk track — thinking, then the world, then knowledge, then teams, then state trust; then tools and the traces they leave 05 / 13 edit whole graph The job, before and after press next: the old job becomes a new one — then meet the state it tends, and its five questions graph-first ontology the prerequisite classes, relations, constraints — designed before use :moves ontology the runtime contract hardened where correctness matters usage agent workflows day one proposals LLM extracts nodes + edges from traces validators humans + AIs approve or reject :then Ingestion & schema built before anyone benefits :then usage finally — if anyone still trusts it :dead_end trust decays no connection loop - stale facts 07 / 13 - 0/2 edit whole graph The job, before and after press next: the old job becomes a new one — then meet the state it tends, and its five questions the old job finish the ontology model every fact before anyone benefits :becomes the new job keep living state trustworthy harden what agents actually use Agent teams workers, roles, handoffs 07 / 13 - 2/2 edit whole graph ...and who is building it 27 companies, bootstrapped engines to $2.6B platforms — Zap you have already met! The graph market six segments - new stack KG construction documents — nodes + edges Agent memory temporal state for agents Graph databases store the world graph Semantic KG platforms the attention-slice lineage Entity resolution who is who, at scale Graph viz & investigation seeing the topology 09 / 13 edit whole graph Pick your graph six routes, one column each — the idea, then press next: what to build, then where to beat SOTA Pick your graph idea — build it — beat SOTA Reasoning / plans branches, search, dependencies :then World / UI agents map the interface :then Knowledge / memory temporal becomes durable context :then Agent teams workers, roles, handoffs Tools / skills code as dependency graphs Traces / evals logs that look like a graph :then :result LangSmith / Phoenix trace observability Zep / GraphRAG temporal memory graphs 10 / 13 - 0/2 edit whole graph Pick your graph six routes, one column each — the idea, then press next: what to build, then where to beat SOTA Reasoning / plans branches, search, dependencies :then World / UI agents map the interface :then Knowledge / memory temporal becomes durable context :then Agent teams workers, roles, handoffs Tools / skills code as dependency graphs Traces / evals logs that look like a graph :then :result LangSmith / Phoenix trace observability :build Zep / GraphRAG temporal memory graphs :build branch — score — select planner build this affordance graph of one site build this temporal KG of your inbox build this handoff graph for 3 agents build this typed registry + permissions build this replayable trace of one agent build this verifier-guided search build this 10 / 13 - 2/2 edit whole graph The loop above the loop agents improve by running, communities improve by sharing; you improve by shortening your own learning cycle observe agent loop act reason traces community loop standards patterns instrument developer loop share compare 11 / 13 edit whole graph
- Camera
- Continuous panning and zooming across a large, interconnected graph, highlighting different sections and their relationships.
- Motion
- Smooth camera movements, node expansion, and animated path tracing to illustrate complex workflows and loops.
Feature Teaser
The Unified Graph View and Call to Action
“(No spoken dialogue — final product overview and call to action.)”
- On screen
- Graphs are awesome GraphCon July 25, 2026 ideas the new way the old way things e edit o overview - navigate - drag pan - scroll zoom click dim node to travel - hover for detail (you)-[:builds]->(graphs) thank you — go draw the edges you :builds graphs 12 / 13 edit whole graph One graph zoomed all the way out — the window replays every slide, and the nodes push in and out just like they did 13 / 13 edit whole graph Graphs are awesome GraphCon July 25, 2026 ideas the new way the old way things e edit o overview - navigate - drag pan - scroll zoom click dim node to travel - hover for detail Order vs chaos the same seven nodes and seven edges — drawn, the structure is obvious; listed, it is invisible same data seven nodes - seven edges :drawn_as :stored_as Order drawn as a graph — the topology is visible Chaos stored as tables — the topology is hidden nodes edges a a-b b b-c c c-d d d-e e e-f f f-g g 13 / 13 edit whole graph Nodes and edges Business people + orgs (founder_of, fund_of, fund_to, connected_to, class) Objects path, dependencies (owns, is_part_of, is_type_of, uses) Places locations, nodes (part_of, is_adjacent_to) Social people, trust, influence (follows, is_friend_of, is_class) Beliefs claims, evidence, revision (is_claim_of, based_on, is_false) Pick your graph six routes, one column each — the idea, then press next: what to build, then where to beat SOTA Everything is a graph Everything is a graph press next: ten real things, five domains, one interwoven graph Graphs are awesome because relationships are where the meaning lives agent state agent loop observe act reason traces community loop standards patterns instrument developer loop share compare 13 / 13 edit whole graph Graphs are awesome GraphCon July 25, 2026 ideas the new way the old way things e edit o overview - navigate - drag pan - scroll zoom click dim node to travel - hover for detail Agents got graph-shaped in public the talk track — thinking, then the world, then knowledge, then teams, then state trust; then tools and the traces they leave Reasoning / plans branches, search, dependencies :then World / UI agents map the interface :then Knowledge / memory temporal becomes durable context :then Agent teams workers, roles, handoffs Tools / skills code as dependency graphs Traces / evals logs that look like a graph :then :result BabyAGI / AutoGPT / ToT Mar - May 2023 planning + reasoning trees AutoGen / Assistants API Sep - Nov 2023 agent + human / threads as class Microsoft GraphRAG Jul 2024 agent + human as entity linked via LangGraph Jan 2024 agent + index, edges, cycles, checkpoints Operator / Responses API Jan - Mar 2025 discover one agent as a component MCP Nov 2024 open standard — tools + agent as a dependency graph agent state 13 / 13 edit whole graph
- Camera
- A rapid zoom-out to reveal the entire graph, followed by a dynamic replay of previous node interactions within the zoomed-out view.
- Motion
- Reverse zoom, synchronized node pulsing, and animated path highlights to summarize the product's capabilities.
Motion design primitives
Synthesizable in Remotion · key components of the graph-based-project-visualizer template.
GraphNodeZoom
A smooth, controlled camera zoom into a specific node within a larger graph, bringing its content into focus while dimming surrounding nodes.
+ Code construction recipe
Utilize Remotion's `interpolate` for camera position (x, y) and scale, with an `ease-in-out` curve. Implement opacity changes for non-focused nodes using `spring` for a subtle fade effect.
DynamicPathTrace
Animated lines (edges) appear between nodes, illustrating connections and data flow, often accompanied by a subtle glow or highlight.
+ Code construction recipe
Employ SVG path animations with `stroke-dasharray` and `stroke-dashoffset` properties, interpolated over time. Use `spring` for the initial appearance of the path and a `linear` interpolation for the tracing effect.
ContentRevealPulse
When a node is selected or zoomed into, its internal text content or sub-elements subtly fade in or 'pulse' into visibility.
+ Code construction recipe
Apply `opacity` and `scale` transformations to text and sub-elements using Remotion's `spring` function with a slight delay for a staggered reveal. Consider a `filter: blur` transition for a softer appearance.
Style DNA & aesthetic system
Visual aesthetic
Typography
Motion
Special effects
Pacing & rhythm
Conceptual story rhythm
- 1
The Grand Overview
Purpose. Introduce the product's core concept: a graph-based system for organizing complex information.
Execution. A wide shot of the entire graph, quickly zooming into a central node to grab attention and establish the visual language.
- 2
Problem & Solution
Purpose. Highlight the challenge of information overload and present the graph system as a solution for clarity and structure.
Execution. Sequential zooms and pans to specific nodes, demonstrating how complex data is organized and interconnected, contrasting 'Order' with 'Chaos'.
- 3
Deep Dive & Features
Purpose. Showcase the system's capabilities, demonstrating how different types of information and workflows are managed within the graph.
Execution. Extended, fluid camera movements across various sections of the graph, revealing detailed nodes, animated paths, and content reveals for specific features like 'Agent Loop' and 'Pick your graph'.
- 4
Synthesis & Call to Action
Purpose. Summarize the product's value proposition and encourage engagement.
Execution. A dramatic zoom-out to reveal the entire graph again, followed by a dynamic replay of key interactions, culminating in a clear call to action to 'draw the edges'.
Remix in Animatiq Studio
Master remix prompt · agent-ready
Sample remix
Objective
Launch a new AI-powered project management tool, 'TaskGraph', emphasizing its ability to visualize complex project dependencies and team collaborations.How the recipe adapts
The 'TaskGraph' video would open with a wide view of a project graph, showing various tasks and team members as nodes. A 'GraphNodeZoom' primitive would highlight a critical path, revealing sub-tasks and their AI-assigned priorities. 'DynamicPathTrace' would animate the flow of work between team members and tasks, illustrating dependencies. 'ContentRevealPulse' would show task descriptions and deadlines as the camera focuses on individual nodes. The overall pacing would be smooth and continuous, guiding the viewer through the project's lifecycle without abrupt cuts, maintaining the minimalist aesthetic with a focus on information clarity.Remix blueprint · graph-based-project-visualizer
Scene durations (4 scenes, 42s)
Key Remotion components
Related Developer Tools Product Launches
Explore all Developer Tools launches →
xAI opens voice cloning on its API: build a custom voice in about two minutes or pick from 80+ voices in 28 languages.

Claude can now operate your Mac, opening apps, browsing and filling spreadsheets, as a research preview in Cowork and Claude Code.

Agentic CLI for coding, building apps, and automating workflows.