
Conversion · Launch Video Breakdown: Hook, Pacing & Motion Design
The agentic marketing automation platform.
Scene-by-scene timeline & spoken transcript
The Hook
Dinner Party Data Dilemma
“Male speaker presents product benefits in marketing attribution, reporting, and data management.”
- On screen
- ROI by Channel, Client Dinners, Events, Email, Paid
- Camera
- Medium shot of a man speaking at a dinner table, then a wide shot of the table with a floating UI overlay. Subtle camera push-in.
- Motion
- Live-action footage with augmented reality (AR) UI overlay, bar chart animation, and subtle 'whoosh' sound effect at 0:04.
Product Reveal
Introducing Mosaic
“(No spoken dialogue — a subtle 'whoosh' sound effect accompanies the transition at 0:06 and 0:10.)”
- On screen
- Mosaic
- Camera
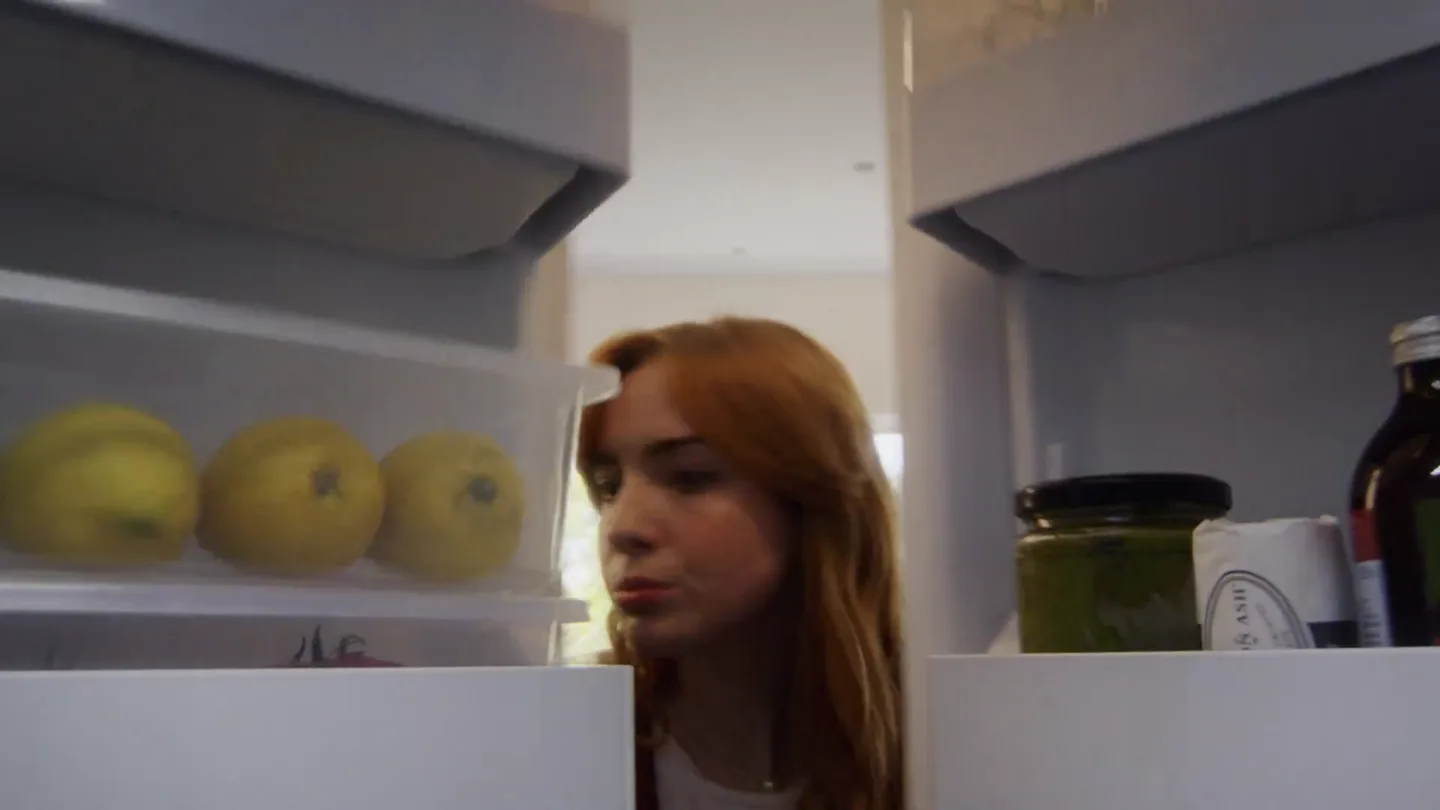
- Close-up on a person eating, then a static shot of the product logo centered on a grid background.
- Motion
- Quick cut from live-action to full-screen motion graphics, logo reveal with a subtle glow and animating grid background.
Feature Teaser
Connecting the Marketing Universe
“Male speaker presents product benefits in marketing attribution, reporting, and data management.”
- On screen
- Your MAP, Attribution, Salesforce, Unified data, Registered, CMO Dinner, SF, May 6, Webinar, Attribution for MOPs, Apr 22, Conversion, Nurture email 3 of 5, Apr 14, LinkedIn, Lead gen form, Attribution Playbook, Apr 9
- Camera
- Medium shot of the presenter at the dinner table, then a static shot of the UI with notifications.
- Motion
- Animated data points and lines connecting various app icons around the presenter, followed by animated notification pop-ups appearing and fading with 'whoosh' sound effects at 0:13, 0:16, 0:22, 0:24, 0:30.
Product Reveal
Intelligent Reporting & Insights
“Male speaker presents product benefits in marketing attribution, reporting, and data management.”
- On screen
- Deal, Company, Amount, Stage, Close date, Companies, Figma, figma.com, Activity, Details, Company details, Company Name, Industry, Website, Number of Employ..., 1,001-5,000, May 6th, 2023, tara.p..., Client..., Closed-won deals, 49% of the identified deals were closed-wons., 60%, 45%, 30%, 15%, 0%, Closed-won, Other, Ask anything..., What percent of closed won deals touched a dinner?, Used 10 tools, Here's what's shown across all 36 deals:, Deals, Won, Source, Win rate, Won revenue, Avg deal, Partner, 5, 5, 100%, $1.42M, $284k, External Referral, 8, 6, 75%, $1.45M, $241k, Web, 1, 1, 100%, $235k, $235k, Trade Show, 1, 1, 100%, $220k, $220k, Word of mouth, 4, 3, 75%, $185k, $62k, Public Relations, 2, 2, 100%, $140k, $70k, Employee Referral, 2, 0, 0%, -, -, Phone inquiry, 1, 0, 0%, -, -, Purchased List, 1, 0, 0%, -, -, Not set, 11, 0, 0%, -, $1.52M open, What channels are we underinvested in under a last touch model?, Conversion, Used 12 tools, How did ABM accounts perform against the baseline?
- Camera
- Full-screen UI demo, with subtle camera pans and zooms within the UI.
- Motion
- Smooth UI transitions, data visualization animations (bar charts growing, tables populating), AI chat interface typing and revealing answers, accompanied by 'whoosh' sound effects at 0:33, 0:40, 0:45, 0:47, 0:52.
Feature Teaser
Automated Workflow Integration
“Male speaker presents product benefits in marketing attribution, reporting, and data management.”
- On screen
- Thread, # mops, Mosaic APP 4:00 PM, Dinners are working. Paid search isn't., Pause Google Non-Brand and move that budget into 4 more dinners?, 1 reply, Priya Just now, yes, do it, Reply..., Done. Non-Brand paused. 4 dinners drafted for your review., Open in Conversion, 1, 2
- Camera
- Medium shot of the presenter, then full-screen UI demo of a Slack thread.
- Motion
- Presenter gestures, then animated Slack messages appearing, simulating real-time interaction with the Mosaic bot. Subtle 'whoosh' sound effect at 1:11.
Product Reveal
Mosaic: The Agentic Platform
“(No spoken dialogue — a subtle 'whoosh' sound effect accompanies the logo reveal.)”
- On screen
- saic
- Camera
- Static shot of the product logo centered on a grid background.
- Motion
- Logo reveal with a subtle glow and animating grid background, reinforcing brand.
Call to Action
The Future of Marketing Automation
“Multiple speakers engage in a casual, humorous discussion.”
- On screen
- (No on-screen text)
- Camera
- Wide shot of the dinner table from above, then fades to black.
- Motion
- Live-action social scene, slow zoom out, fade to black. Accompanied by 'whoosh' sound effects at 1:22, 1:24, 1:27, 1:30, and a distinct 'whoosh' with a light 'chime' or 'ding' at 1:29.
Motion design primitives
Synthesizable in Remotion · key components of the agentic-saas-launch-template template.
GradientGridReveal
A grid of squares, each subtly colored, forms a smooth gradient across the screen. A central element (logo) appears with a soft glow, while the grid subtly animates or shifts color, creating a dynamic background for brand reveals.
+ Code construction recipe
Utilize a `Grid` component with `interpolate` for color values based on each square's position. Apply a `spring` animation for the central logo's scale and opacity. Implement `SVG filters` for the soft glow effect around the logo.
ARDataOverlay
Semi-transparent, rounded-rectangle UI elements (charts, data points, notifications) appear and animate over live-action footage, maintaining a sense of perspective. Data points connect with animated lines, illustrating data flow.
+ Code construction recipe
Overlay `Layer` components for UI elements on top of an `AbsoluteFill` live-action video. Use `spring` for position, scale, and opacity animations. Render connecting lines with `SVG paths` and animate `stroke-dasharray` for a drawing effect. Apply `backdrop-filter: blur()` for a frosted glass aesthetic.
DynamicUIDemo
Full-screen UI elements such as tables, charts, and chat bubbles smoothly transition, populate with data, and respond to simulated user input (e.g., typing animation for AI queries, growing bar charts).
+ Code construction recipe
Orchestrate UI element appearances using `Sequence`. Employ `spring` for smooth entry and exit animations of individual components. Utilize `interpolate` for progress bars, chart growth, and text typing effects. Custom chart rendering can be achieved with `Canvas` or `SVG`.
ContextualNotificationPop
Small, rounded-rectangle notification cards pop up from various points on the screen, often with a subtle bounce or slide, displaying concise information relevant to the scene.
+ Code construction recipe
Position notification elements using `Absolute` styling. Animate `y` position and `opacity` with a `spring` function that includes a slight overshoot for a bouncy feel. Implement `delay` for staggered appearance of multiple notifications.
Style DNA & aesthetic system
Visual aesthetic
Typography
Motion
Special effects
Pacing & rhythm
Conceptual story rhythm
- 1
The Relatable Problem
Purpose. Establish a common pain point in marketing data management within a familiar, human context.
Execution. Live-action dinner scene, then an AR overlay showing fragmented data or confusing metrics.
- 2
The Elegant Solution
Purpose. Introduce the product (Mosaic) as the answer to the problem.
Execution. Clean, full-screen logo reveal with a modern, gradient grid background.
- 3
Unified Intelligence
Purpose. Demonstrate how the product integrates disparate data sources into a single, coherent view.
Execution. Animated data points and lines connecting various app icons around the presenter, culminating in a 'unified data' visual.
- 4
Actionable Insights
Purpose. Showcase the product's ability to provide deep, queryable insights and facilitate real-time decision-making.
Execution. UI demo with interactive charts, data tables, and an AI chat interface generating answers, followed by a Slack integration showing automated actions.
- 5
The Human Impact
Purpose. Reiterate the product's value by showing its positive effect on users and team collaboration.
Execution. Return to the live-action dinner scene, showing engaged, satisfied users discussing the product's benefits.