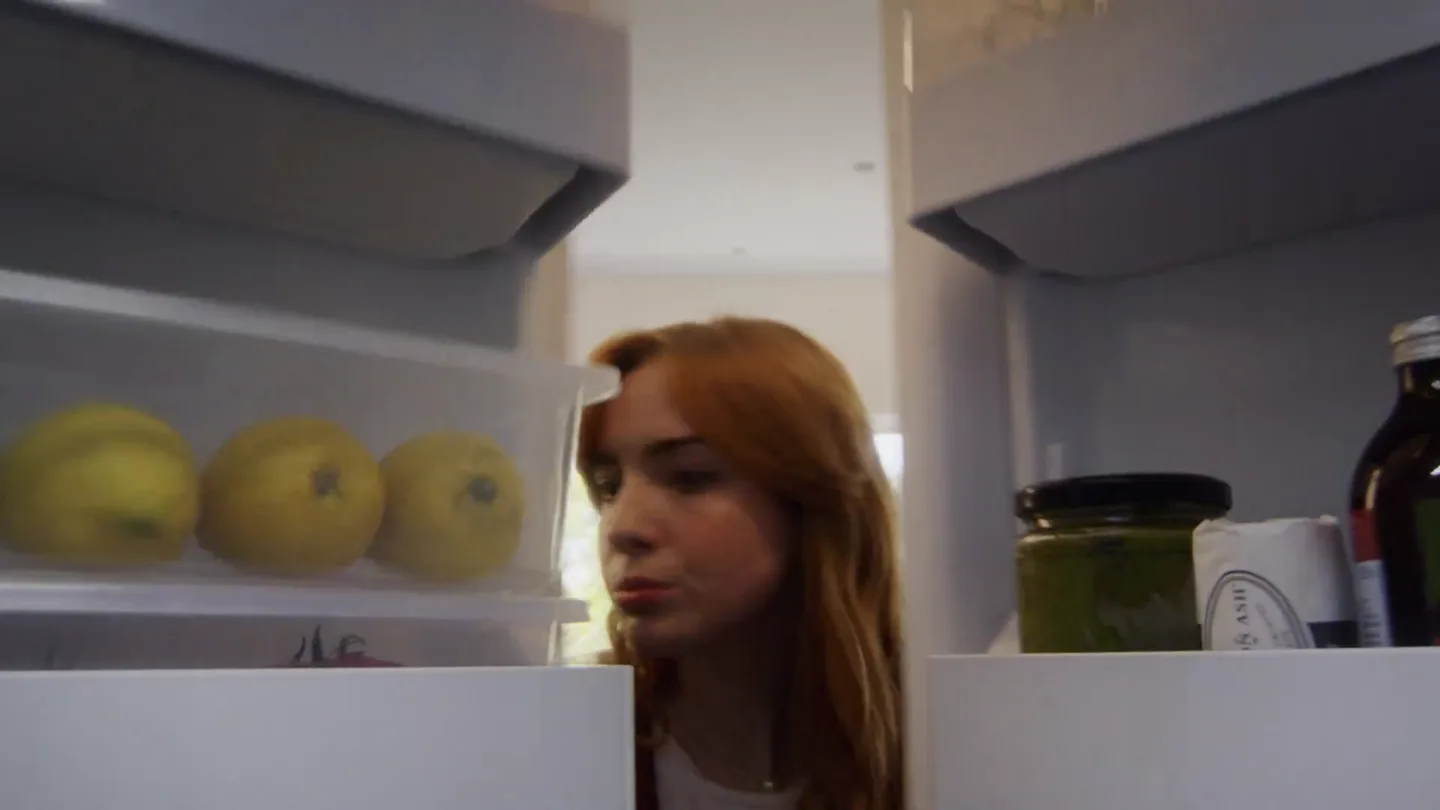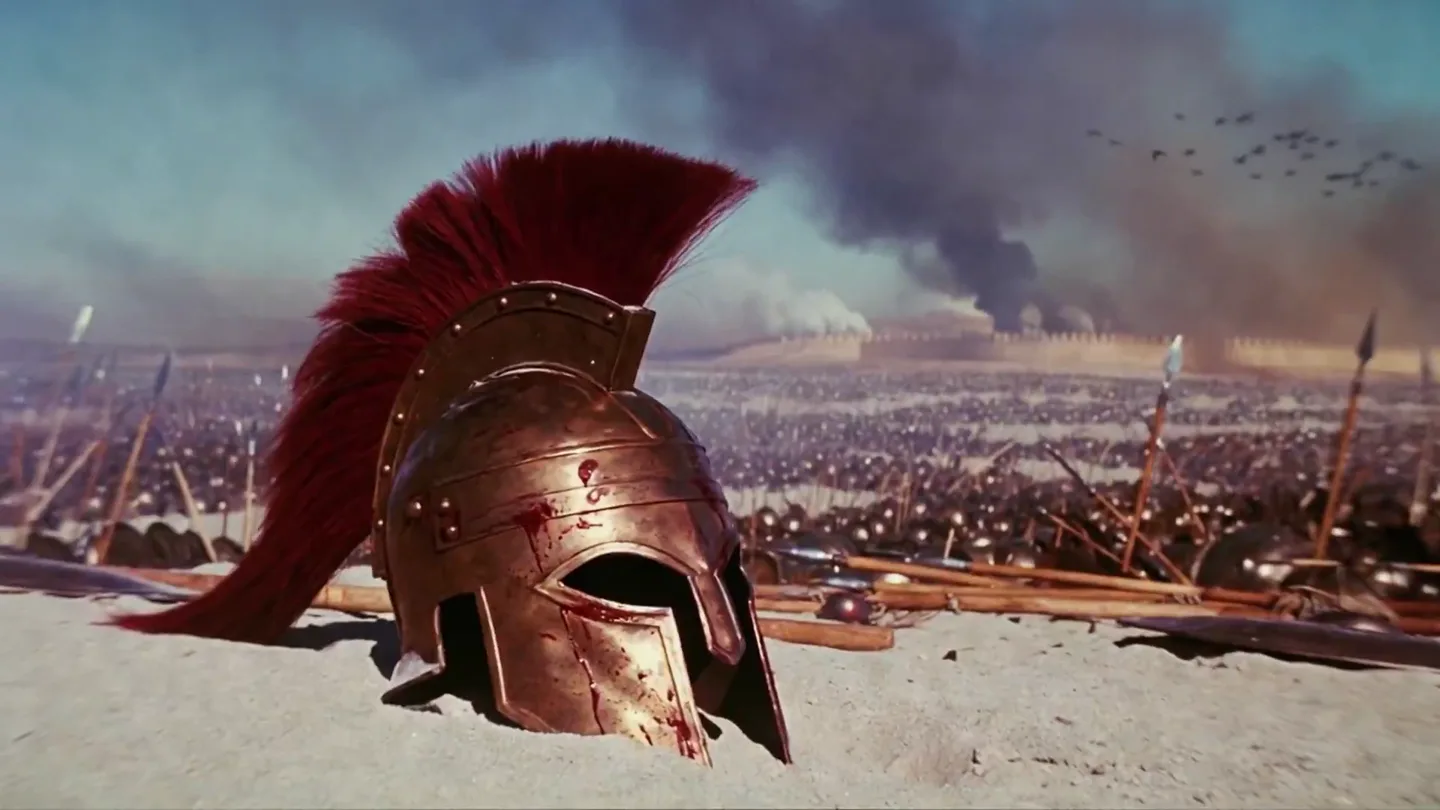

Globodex Intelligence Layer For Ai Agents (by channel1_ai) · Launch Video Breakdown: Hook, Pacing & Motion Design
Introducing Globodex: the intelligence layer for how people and AI agents understand the world. Globodex watches the world in real time, connects events to what matters to your business, and delivers
Scene-by-scene timeline & spoken transcript
The Hook
Introducing Globodex: The Intelligence Layer
“(No spoken dialogue — The male narrator introduces 'Globodex,' an intelligence layer that analyzes vast amounts of data to provide real-time insights for businesses. The audio track features a dynamic, modern corporate score with high-energy audio transitions, whooshes, and subtle kicks.)”
- On screen
- 00:48.38, Trace - zsl_0542, zsl = trace(), src = 'Southwestern Union L-14', dst = 'Port of Alderby', type = 'dockload_04', conf = 0.84 sources = 3, updates = 0.81, Live events, evt_alderby_strike, unfolding, evt_seize_flood, verified, evt_corvale_grid, monitoring, EVENT DETECTED 21:42 evt_alderby_strike, LIVE WAX
- Camera
- Founder in a medium shot, direct address, in a dark studio with glowing circular lights. Rapid cut to a close-up of a digital timer. Overhead view of a dynamic, interconnected node graph. Close-up on a data card revealing an event.
- Motion
- Direct address, digital timer countdown, generative node graph animation with data pop-ups and connecting lines, clean UI card reveal with text appearing.
Problem Agitation
Navigating Real-World Complexities
“(No spoken dialogue — The male narrator uses examples related to coffee supply chains and global events to illustrate Globodex's capabilities, highlighting the complexity and challenges businesses face in understanding the world. The audio track features a dynamic, modern corporate score with high-energy audio transitions and impactful sub-bass drops.)”
- On screen
- (No on-screen text)
- Camera
- Founder in a bustling cafe, selfie-style, looking directly at the camera. Rapid cut to a dynamic handheld shot of a flooded coffee field. Cut to founder on a stormy ship deck, wearing a yellow raincoat, direct address. Cut back to founder seated in a cafe, wider shot, with a coffee cup.
- Motion
- Rapid scene cuts between founder in diverse, challenging real-world environments and relevant problem-setting footage, emphasizing urgency and global reach. Handheld camera feel for realism and immersion.
Product Reveal
Globodex: Your Real-time Intelligence Hub
“(No spoken dialogue — The narration highlights how Globodex connects disparate information, delivers timely briefings, and integrates with AI agents. The audio track features a dynamic, modern corporate score with high-energy audio transitions and impactful sub-bass drops.)”
- On screen
- ENTITIES TO WATCH, 8 SUGGESTED, Cascade Roast Supply, Valley Dairy Co-op, Oatly, La Marzocco, Arabica prices, Foot traffic, Oat milk, + Add, EVENT TYPES, 6 SUGGESTED, PRICE SPIKE, SUPPLY DISRUPTION, REGULATION, COMPETITOR OPENING, STREET CLOSURE, TARIFF CHANGE, + Add, TIME HORIZON, GEOGRAPHY, 3 MO, 12 MO, 24 MO, Local Metro, Brazil, +, SENSITIVITY, Globodex, ← EVENT, Claim verification, CLAIM CLM_4V81X, Dock crews to walk out Friday – Port of Alderby, ASSERTED JUL 16 · 21:42 BOUND TO JUL 18 · 08:00, EXTRACTED FROM 3 ASSETS · EVENT EVT_ALDERBY_STRIKE, Dockworkers vote to authorize strike, PARENT EVENT · PORT OF ALDERBY · 6 CLAIMS, TRUST WEIGHT, 0.88, High confidence, Independent corroboration, SOURCES · 3, Union hall livestream, C2PA, Strike notice filing, CHAIN VERIFIED, Gate photos · 2, C2PA, KC+F 342.8S, +2.4% ICE, USD/LB, WALKOUT FRI 06:00, LOCAL 9 AUTHORIZED, PORT OF ALDERBY, ETA +3D, ALD-SEA-104, 14 AT ANCHOR, @hazborwatch: lines at the north, gate are the longest since 2024., @freightdesk: spot rates ALD>SEA, up 11% this week. quoting +3days., ENTITY, PORT OF ALDERBY, data:origin,dest,teu,status, 0-16, Santos,Alderby,4210,anchored, 07-16,Callao,Alderby,2874,anchored, 07-17,Alderby,Seattle,3966,hold, <rss version='2.0'><channel>, <title>Port Ops Bulletin</title>, <item><title>Gate 4 closed to, inbound trucks EVENT, STRIKE_VOTE, <item><title>Crane maintenance, window moved to Sunday</title>, Last 30d, GEOGRAPHY, CLEAR, United States, United Kingdom, China, Monaco, Kenya
- Camera
- Close-up on interactive UI elements for filtering. Founder in a medium shot, direct address. Founder seated on a couch next to a monitor displaying the 'Globodex' logo. Detailed UI walkthroughs showcasing claim verification, data linking, and geographical filtering, with a mouse cursor interacting.
- Motion
- Interactive UI animations, data filtering with chip selection, dynamic data linking visualizations, trust score animation with a progress bar, and precise mouse cursor interaction.
Feature Teaser
Proactive Intelligence for Business
“(No spoken dialogue — The narration continues to illustrate how Globodex creates a more trusted and comprehensive picture of the world, emphasizing real-time monitoring and broader application. The audio track features a dynamic, modern corporate score with high-energy audio transitions and impactful sub-bass drops.)”
- On screen
- MONITOR ACTIVE - MATCHING THE EVENT GRAPH, RISE & GRIND - 8 ENTITIES - 24 MO HORIZON - LIVE
- Camera
- Founder in a modern office environment, medium shot, direct address. Rapid cut to dynamic street footage of a protest. Cut back to founder in office, gesturing. Wide shot of a complex, evolving event graph visualization.
- Motion
- Seamless transitions between founder and real-world footage, complex data visualization with evolving node graphs, highlighting real-time monitoring capabilities.
Call to Action
A More Trusted & Comprehensive World
“(No spoken dialogue — The video concludes with a reinforcing message about Globodex's impact and vision. The audio track features a dynamic, modern corporate score with high-energy audio transitions and impactful sub-bass drops, leading to a final brand statement.)”
- On screen
- (No on-screen text)
- Camera
- Founder in a wide studio shot, confident stance, looking directly at the camera. The background features the glowing circular lights.
- Motion
- Clean, confident framing, subtle lighting changes, reinforcing brand presence and the founder's authority.
Motion design primitives
Synthesizable in Remotion · key components of the globodex-intelligence-layer template.
DynamicNodeGraph
An evolving network of interconnected nodes and lines, representing data points and relationships. Nodes pulse and lines animate to show data flow, with contextual data cards appearing on hover or selection.
+ Code construction recipe
Utilize Remotion's `Sequence` and `spring` for node and line animations. Implement `interpolate` for opacity and scale changes. Use SVG paths for lines and `Circle` components for nodes. Data cards can be `AbsoluteFill` or `Layer` components with `useCurrentFrame` for timed reveals and `spring` for entry/exit animations.
ContextualDataCard
Clean, rounded rectangular UI cards that appear smoothly, displaying specific event details, code snippets, or verification information. Text and progress bars animate within the card.
+ Code construction recipe
Create a `Rect` component with `borderRadius` for the card shape. Use `spring` for the card's initial scale and position animation. Text elements can use `Sequence` and `interpolate` for typewriter effects or staggered reveals. Progress bars can be `Rect` components with `interpolate` on `width`.
InteractiveFilterChips
UI elements resembling clickable 'chips' or buttons for selecting and filtering data categories (e.g., entities, event types, geography). They highlight on selection with a distinct color change and subtle scale animation.
+ Code construction recipe
Implement `Button` or `Rect` components with `onClick` handlers to simulate interaction. Use `useCurrentFrame` and `interpolate` to animate `backgroundColor` and `scale` on 'selection' or 'hover' states. `Text` components inside should maintain readability.
ConfidenceMeter
A numeric display (e.g., '0.88') accompanied by a horizontal progress bar that fills up to indicate a 'trust weight' or confidence level, often with a descriptive label ('High confidence').
+ Code construction recipe
Combine `Text` components for the numeric value and label. Use a `Rect` component for the background of the progress bar and another `Rect` component with `interpolate` on its `width` property to animate the fill level. `spring` can be used for the initial reveal of the meter.
Style DNA & aesthetic system
Visual aesthetic
Typography
Motion
Special effects
Pacing & rhythm
Conceptual story rhythm
- 1
The Urgent Problem
Purpose. Establish the complexity and overwhelming nature of real-world data, agitating the pain point of information overload and critical event detection.
Execution. Rapid cuts between the founder in diverse, challenging environments (e.g., stormy sea, flooded field) and abstract, complex data visualizations (e.g., node graphs, event logs).
- 2
The Intelligent Solution
Purpose. Introduce Globodex as the answer to data chaos, positioning the product as the central hub for understanding the world.
Execution. A clean product reveal (monitor with logo) followed by intuitive UI walkthroughs demonstrating data aggregation, filtering, and event connection.
- 3
Verified Trust
Purpose. Highlight the accuracy and reliability of Globodex's insights, building confidence in the product's ability to provide ground-truth intelligence.
Execution. Visualizations of trust scores, source verification, and data lineage, emphasizing transparency and the robust validation process.
- 4
Proactive Monitoring
Purpose. Showcase real-time event detection and impact analysis, demonstrating the product's capability to provide foresight and actionable intelligence.
Execution. Dynamic event graphs evolving in real-time, seamlessly integrating with real-world footage of events (e.g., protests, supply chain disruptions).
- 5
Empowering the Future
Purpose. Conclude with the broader vision of a more informed and trusted world, inspiring viewers with the transformative potential of Globodex.
Execution. The founder in a confident, expansive studio setting, reinforcing the brand's authority and the product's overarching vision.